Important: This documentation covers Yarn 1 (Classic).
For Yarn 2+ docs and migration guide, see yarnpkg.com.

Package detail

@dickyindra/klinecharts

liihuu193Apache-2.08.3.6-7TypeScript support: included

Lightweight k-line chart built with html5 canvas

k-line, time-line, candlestick, technical-indicators, finance, klinechart, stockchart, stock, chart, canvas

readme

KLineChart

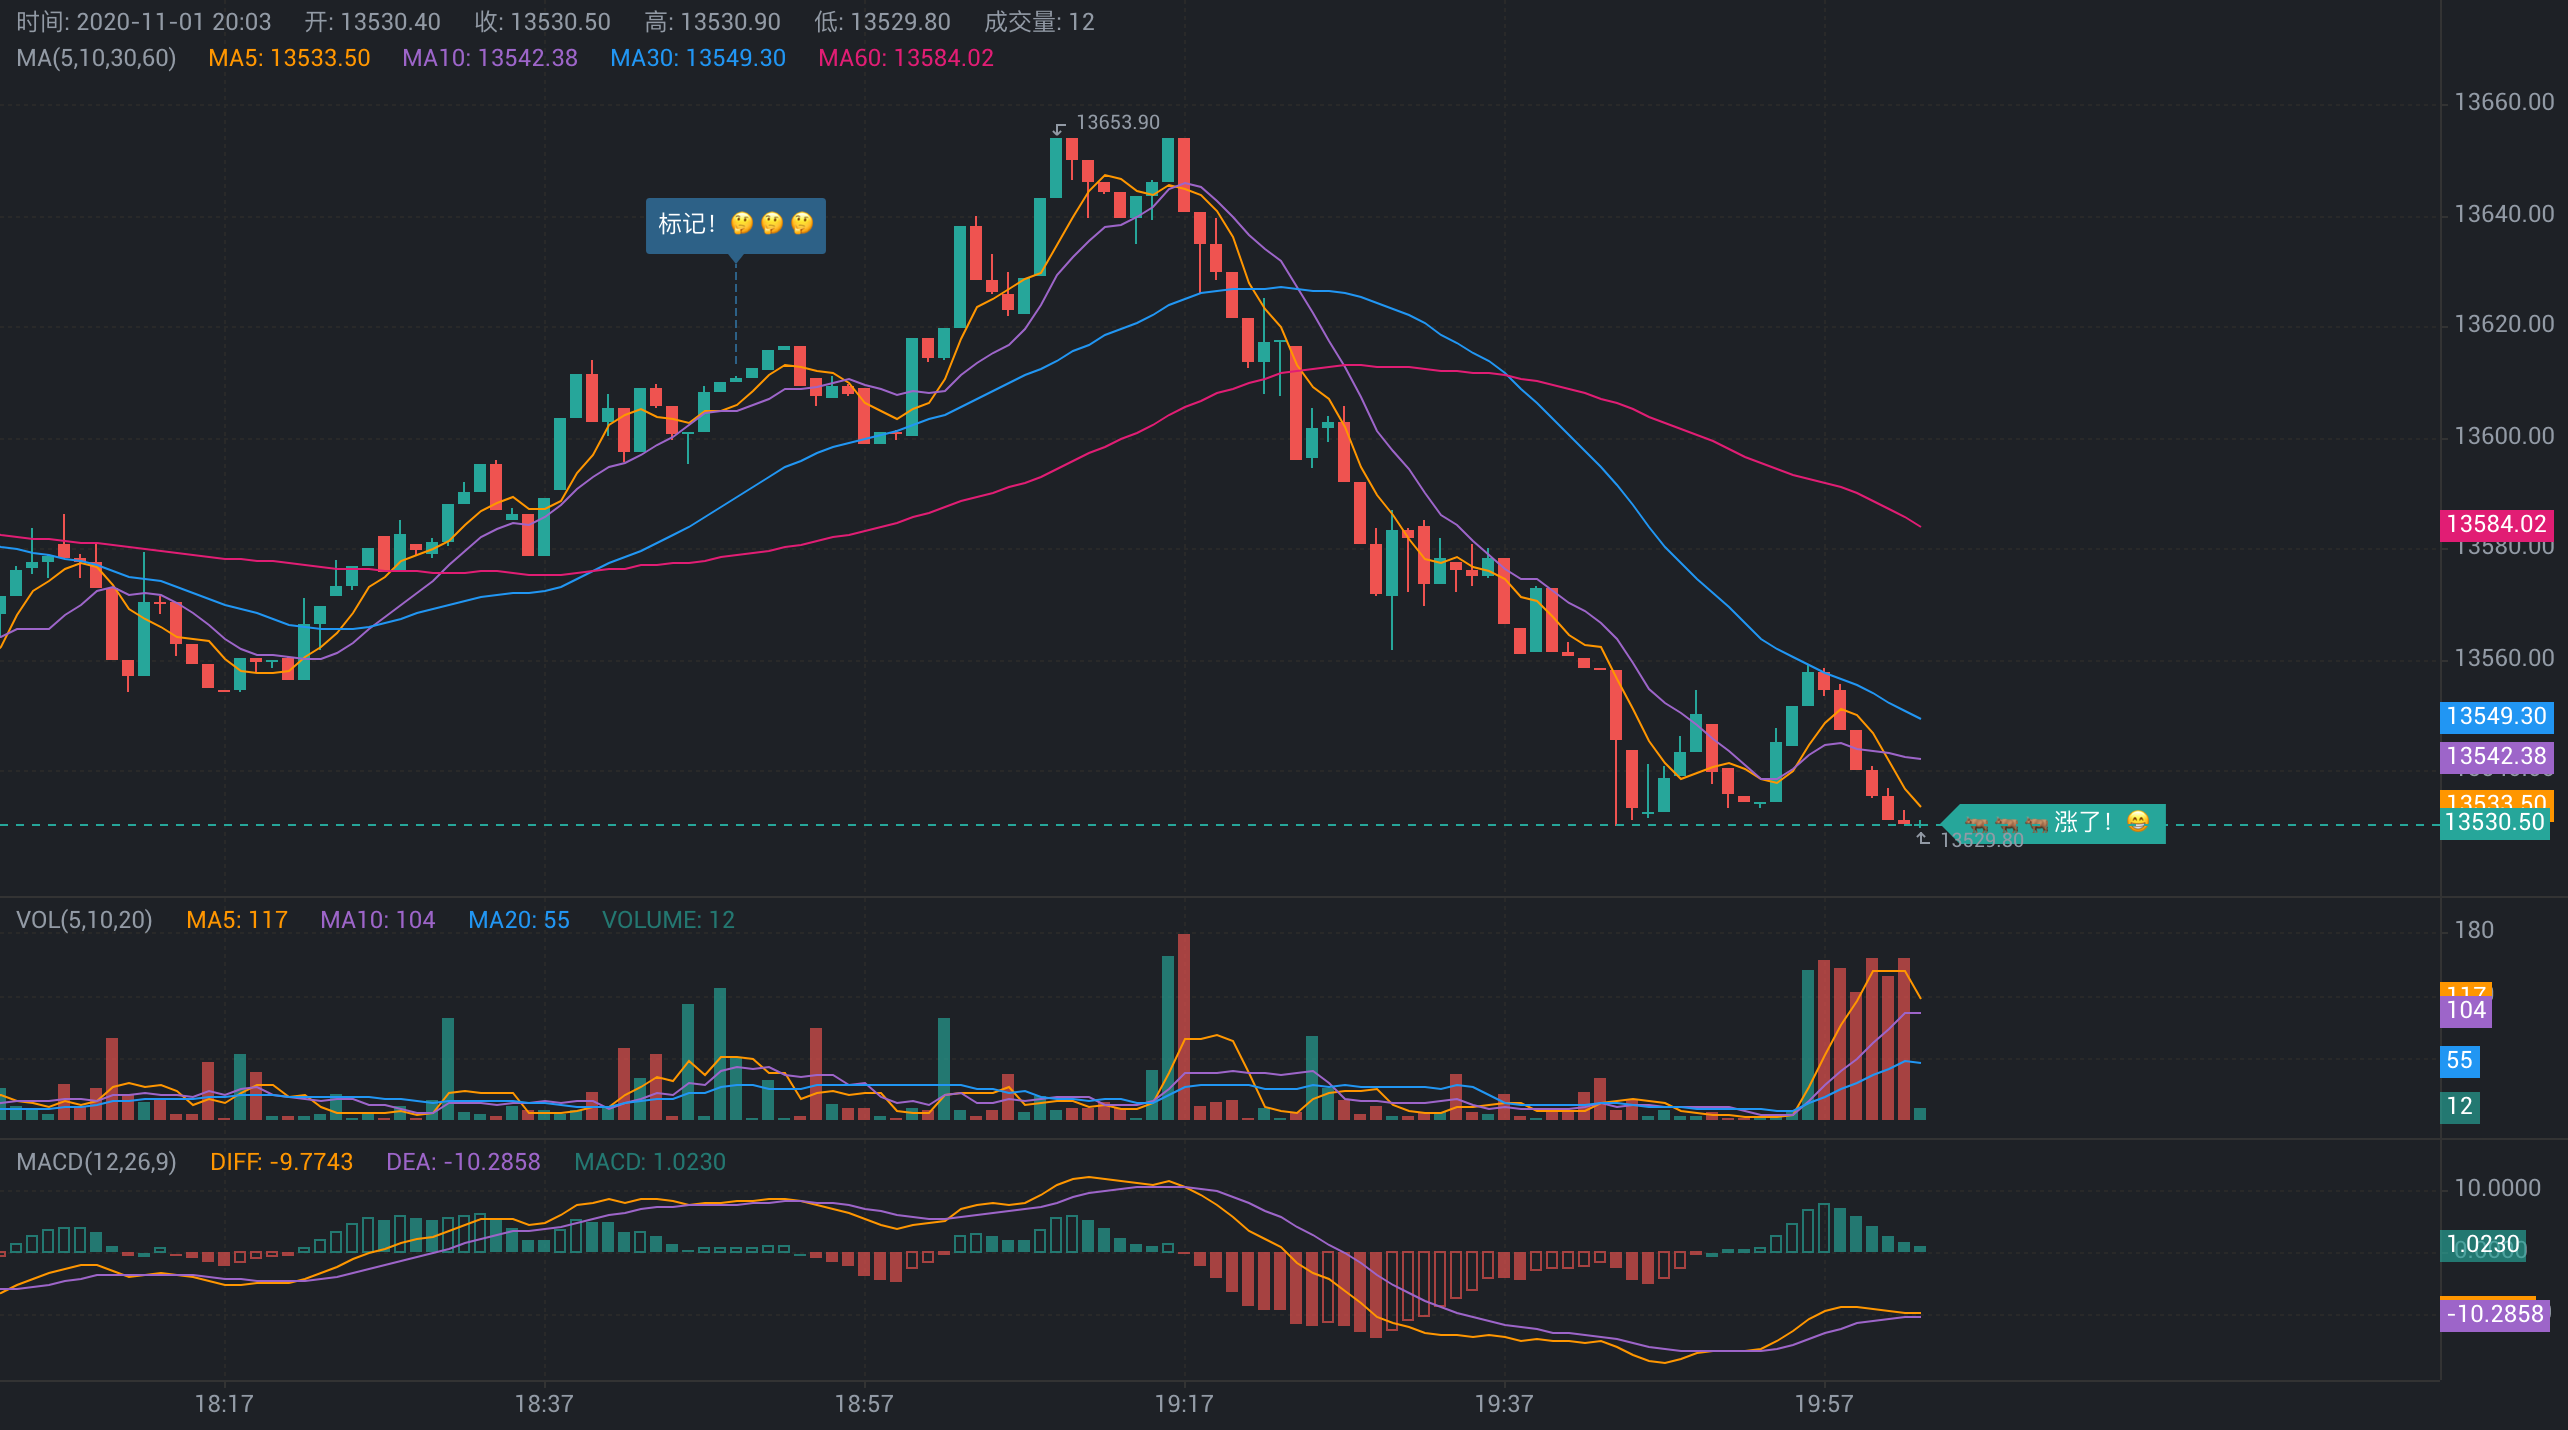
💹📈Lightweight k-line chart built with html5 canvas.

Version Build Status Size Dependencies Typescript LICENSE

📦 Install

Using npm

npm install klinecharts --save

Using yarn

yarn add klinecharts

CDNs

unpkg

https://unpkg.com/klinecharts/dist/klinecharts.min.js

jsDelivr

https://cdn.jsdelivr.net/npm/klinecharts/dist/klinecharts.min.js

📄 Docs

🛠️ Build

Execute command in root directory. Node.js is required.

# Install the dependencies from NPM:
npm install

# Build files:
npm run build

The generated files are in the dist folder.

©️ License

KLineChart is available under the Apache License V2.

❤️ Sponsor Author

PayPal

Digital assets

changelog

Change Log

8.3.6

2022-03-23

  • 🐞 Fix shape issues on the mobile.

8.3.5

2022-03-17

  • 🐞 Fix the issue that indicator stacking may not refresh in real time.
  • 💄 Indicator parameters can be set to negative values.

8.3.3

2022-02-21

  • 🐞 Fix the problem that the shape attribute lock does not take effect.
  • 💄 Optimize the display of technical indicator names.

8.3.2

2022-01-31

  • 🐞 Fix the problem that the technical indicator prompts are displayed incorrectly.

8.3.1

2022-01-18

  • 🐞 Fix createShape attribute mode does not take effect.

8.3.0

2022-01-16

  • 🆕 Export some basic chart methods.
  • 🆕 Technical indicator template calculation supports asynchronous.
  • 🆕 Add method createTooltipDataSource for technical template.
  • 🆕 Add callback parameter paneId for chart action type crosshair.
  • 🐞 Fix the problem that the independent style line.colors of technical indicators does not take effect.
  • 🐞 Fix the problem of drawing error when the shape type is polygon.
  • 🐞 Fix shape mode setting not taking effect.
  • 🐞 Fix style configuration candle.tooltip.showType and technicalIndicator.tooltip.showType for 'rect' chart error.
  • 🐞 Fix wrong typescript declaration.

8.2.0

2022-01-10

  • 🆕 Add instance methods createHtml and removeHtml.
  • 🆕 Instance methods subscribeAction and unsubscribeAction add type tooltip.
  • 🆕 Technical indicator template add attribute shortName.
  • 🆕 Technical indicator template attribute plot.color supports line.
  • 🆕 Technical indicator template attribute styles supports margin.
  • 💄 Optimize mobile scroll event response.

8.1.1

2021-12-19

  • 🐞 Fix the problem that the style technicalIndicator.tooltip.defaultValue does not take effect.
  • 🐞 Fix the problem that dragging on the axis may cause the chart to display abnormally.
  • 💄 Optimize shape, onPressedMove event.

8.1.0

2021-11-30

  • 🆕 Style configuration adds tag.mark.offset, tag.mark.borderColor, tag.mark.borderSize, tag.text.borderColor, tag.text.borderSize.
  • 🐞 Fix the data loading page refresh problem.

8.0.0

2021-10-29

  • 🆕 New features
    • Added getDataSpace and getBarSpace.
    • createTechnicalIndicator supports overwriting built-in attributes when creating.
    • overrideTechnicalIndicator supports overriding indicator properties on a certain window.
    • getTechnicalIndicatorByPaneId supports obtaining individual technical indicator information.
    • Shapes, annotations, and labels can be created on any window.
    • Shapes support overall drag, support weak magnet and strong magnet mode, support custom data.
  • 👉 Change
    • extension.addTechnicalIndicator changed to extension.addTechnicalIndicatorTemplate.
    • extension.addGraphicMark changed to extension.addShapeTemplate.
    • Chart instance
      • createGraphicMark is changed to createShape, and the parameters are merged.
      • addCustomGraphicMark changed to addShapeTemplate.
      • getGraphicMark changed to getShape.
      • removeGraphicMark changed to removeShape.
      • setGraphicMarkOptions changed to setShapeOptions.
      • addCustomTechnialIndicator changed to addTechnicalIndicatorTemplate.
      • getTechnicalIndicatorByName changed to getTechnicalIndicatorTemplate.
      • Added parameter paneId in removeAnnotation.
      • Added parameter paneId to removeTag.
      • scrollToPosition changed to scrollToDataIndex.
      • zoomAtPosition changed to zoomAtDataIndex.
      • getConvertPictureUrl parameters includeTooltip and includeGraphicMark are merged into includeOverlay.
      • subscribeAction and unsubscribeAction, remove the drawCandle and drawTechnicalIndicator types.
      • convertToPixel and convertFromPixel, the input parameters are changed to { timestamp, dataIndex, value } and { paneId, absoluteYAxis }.
    • Shape
      • checkMousePointOn is changed to checkEventCoordinateOnShape, and the parameter is changed to object.
      • The createShapeDataSource parameter is changed to object.
      • performMouseMoveForDrawing is changed to performEventMoveForDrawing, and the parameter is changed to object.
      • performMousePressedMove is changed to performEventPressedMove, and the parameter is changed to object.
      • The drawExtend parameter is changed to object.
    • Technical indicators
      • The property calcParamsAllowDecimal is merged into calcParams.
      • The attribute baseValue is merged into plots.
      • Property plots, color callback parameters are changed to { prev, current, next }.
      • The calcTechnicalIndicator parameter is changed to object.
      • The render parameter is changed to object.
    • Style configuration
      • candle.tooltip.rect.fillColor changed to candle.tooltip.rect.backgroundColor.
      • candle.area.fillColor changed to candle.area.backgroundColor.
      • annotation.symbol.position changed to annotation.position.
      • annotation.symbol.offset changed to annotation.offset.
    • Shape assistance API
      • getRotatePoint changed to getRotateCoordinate.
      • getLinearYFromPoints changed to getLinearYFromCoordinates.
      • checkPointOnStraightLine changed to checkCoordinateOnStraightLine.
      • checkPointOnRayLine changed to checkCoordinateOnRayLine.
      • checkPointOnSegment changed to checkCoordinateOnSegment.
      • checkPointOnArc changed to checkCoordinateOnArc.
      • checkPointInCircle changed to checkCoordinateInCircle.
      • checkPointOnCircle changed to checkCoordinateOnCircle.
      • checkPointInTriangle changed to checkCoordinateInTriangle.
      • checkPointInDiamond changed to . checkCoordinateInDiamond.
      • checkPointInRect is changed to . checkCoordinateInRect.
  • 💄 optimization
    • Optimize the rendering level.
    • Optimize data storage of technical indicators.
    • Optimize the response to mouse events of shapes.
    • Optimize the drawing efficiency of shapes.
  • 🐞 Bug fix
    • Fixed the problem that the y-axis does not refresh when calling setPaneOptions.

8.0.0-alpha7

2021-10-22

  • 🆕 The technical indicators are added back to the attribute series.
  • 💄 Optimize data storage of technical indicators.

8.0.0-alpha6

2021-10-08

  • 🐞 Fix the problem that all shape cannot be removed.
  • 🐞 Fix the problem of incorrect acquisition of technical indicators.

8.0.0-alpha5

2021-09-23

  • 🐞 Fix the typescript declaration problem.

8.0.0-alpha4

2021-09-13

  • 🐞 Fix the problem that loading more does not take effect.
  • 🐞 Fix the problem that the time zone setting does not take effect.

8.0.0-alpha3

2021-09-13

  • 🐞 Fix the problem of incorrect display of area chart.
  • 🐞 Fix the problem that the latest price line of area chart is not displayed.

8.0.0-alpha2

2021-09-10

  • 🐞 Fix the problem that the custom rendering callback parameters of the technical indicator template are not correct.
  • 💄 Optimize the rendering level.

8.0.0-alpha1

2021-09-07

  • 🆕 New features
    • Added getDataSpace and getBarSpace.
    • createTechnicalIndicator supports overwriting built-in attributes when creating.
    • overrideTechnicalIndicator supports overriding indicator properties on a certain window.
    • getTechnicalIndicatorByPaneId supports obtaining individual technical indicator information.
    • Shapes, annotations, and labels can be created on any window.
    • Shapes support overall drag, support weak magnet and strong magnet mode, support custom data.
  • 👉 Change
    • extension.addTechnicalIndicator changed to extension.addTechnicalIndicatorTemplate.
    • extension.addGraphicMark changed to extension.addShapeTemplate.
    • Chart instance
      • createGraphicMark is changed to createShape, and the parameters are merged.
      • addCustomGraphicMark changed to addShapeTemplate.
      • getGraphicMark changed to getShape.
      • removeGraphicMark changed to removeShape.
      • setGraphicMarkOptions changed to setShapeOptions.
      • addCustomTechnialIndicator changed to addTechnicalIndicatorTemplate.
      • getTechnicalIndicatorByName changed to getTechnicalIndicatorTemplate.
      • Added parameter paneId in removeAnnotation.
      • Added parameter paneId to removeTag.
      • scrollToPosition changed to scrollToDataIndex.
      • zoomAtPosition changed to zoomAtDataIndex.
      • getConvertPictureUrl parameters includeTooltip and includeGraphicMark are merged into includeOverlay.
      • subscribeAction and unsubscribeAction, remove the drawCandle and drawTechnicalIndicator types.
      • convertToPixel and convertFromPixel, the input parameters are changed to { timestamp, dataIndex, value } and { paneId, absoluteYAxis }.
    • Shape
      • checkMousePointOn is changed to checkEventCoordinateOnShape, and the parameter is changed to object.
      • The createShapeDataSource parameter is changed to object.
      • performMouseMoveForDrawing is changed to performEventMoveForDrawing, and the parameter is changed to object.
      • performMousePressedMove is changed to performEventPressedMove, and the parameter is changed to object.
      • The drawExtend parameter is changed to object.
    • Technical indicators
      • The property calcParamsAllowDecimal is merged into calcParams.
      • The attribute baseValue is merged into plots.
      • Property plots, color callback parameters are changed to { prev, current, next }.
      • The calcTechnicalIndicator parameter is changed to object.
      • The render parameter is changed to object.
    • Style configuration
      • candle.tooltip.rect.fillColor changed to candle.tooltip.rect.backgroundColor.
      • candle.area.fillColor changed to candle.area.backgroundColor.
      • annotation.symbol.position changed to annotation.position.
      • annotation.symbol.offset changed to annotation.offset.
    • Shape assistance API
      • getRotatePoint changed to getRotateCoordinate.
      • getLinearYFromPoints changed to getLinearYFromCoordinates.
      • checkPointOnStraightLine changed to checkCoordinateOnStraightLine.
      • checkPointOnRayLine changed to checkCoordinateOnRayLine.
      • checkPointOnSegment changed to checkCoordinateOnSegment.
      • checkPointOnArc changed to checkCoordinateOnArc.
      • checkPointInCircle changed to checkCoordinateInCircle.
      • checkPointOnCircle changed to checkCoordinateOnCircle.
      • checkPointInTriangle changed to checkCoordinateInTriangle.
      • checkPointInDiamond changed to . checkCoordinateInDiamond.
      • checkPointInRect is changed to . checkCoordinateInRect.
  • 💄 optimization
    • Optimize the response to mouse events of shapes.
    • Optimize the drawing efficiency of shapes.
  • 🐞 Bug fix
    • Fixed the problem that the y-axis does not refresh when calling setPaneOptions.

7.5.0

2021-06-16

  • 🆕 Add tag, new api createTag and removeTag.
  • 🐞 Fix the problem that the onRemove method does not trigger when deleting all graphic marks.
  • 🐞 Fix the problem of incorrect return of getConvertPictureUrl.
  • 💄 Combine overlay and tooltip.
  • 💄 Optimize the y-axis display when there is no data.
  • 💄 Optimize the interaction of the cross cursor on the mobile.

7.3.3

2021-06-03

  • 🐞 Fix the inaccurate calculation of the coordinate point parameters of the annotation callback method.
  • 💄 Optimize the y-axis display.

7.3.2

2021-06-01

  • 👉 The default style is changed to be suitable for light theme.
  • 🐞 Fix the problem of technicalIndicator.tooltip.showType: rect.

7.3.1

2021-05-31

  • 💄 Optimize the display of yAxis.type:log.

7.3.0

2021-05-28

  • 🆕 Add api scrollByDistance, scrollToRealTime, scrollToPosition, zoomAtCoordinate and zoomAtPosition.
  • 🆕 Add api setPaneOptions for setting windows.
  • 🆕 Add logarithmic coordinates for the axis, yAxis.type: log.
  • 🆕 Add style configuration, candle.priceMark.last.text.borderRadius, technicalIndicator.lastValueMark.text.borderRadius, crosshair.horizontal.text.borderRadius, crosshair.vertical.text.borderRadius.
  • 🆕 Add touchpad scrolling support.
  • 💪 Api createTechnicalIndicator, window parameters can take effect in real time.
  • 💪 Api setDataSpace and setOffsetRightSpace able to refresh in real time.

7.2.0

2021-05-20

❤️️ 520

  • 🆕 Add style configuration technicalIndicator.tooltip.showType.
  • 🆕 Api subscribeAction adds the new type pane_drag.
  • 💄 Optimize window drag height adjustment rules.
  • 🐞 Fix area chart display problem.
  • 🐞 Fix the problem of incorrect callback parameters for annotation custom markers.

7.1.0

2021-04-26

  • 🆕 Add annotation feature
    • createAnnotation is used to add annotations
    • removeAnnotation is used to delete annotations
    • Add annotation configuration for styles
  • 🆕 Add api, getGraphicMark, getWidth, getHeight, convertToPixel and convertFromPixel.
  • 🆕 Add onMouseEnter and onMouseLeave events to graphic markers.
  • 🆕 suscribeAction adds the new type crosshair.
  • 🆕 Custom indicator technical calculation parameters support decimals.
  • 💪 Enhanced unsubscribeAction to cancel events in batches.
  • 💪 Enhanced addCustomTechnicalIndicator and addCustomGraphicMark, which can be added in batches.

7.0.2

2021-04-07

  • 🛠 Rewrite technical indicator calculation EMV, ROC, WR, CR, PVT, DMI, MTM, PSY, VR, RSI, OBV, EMA, MACD, SMA, TRIX, CCI

7.0.1

2021-03-29

  • 🆕 Add lock for graphic markers.
  • 💄 getTechnicalIndicatorByPaneId is added to return calculation results.
  • 💄 The DIFF of the technical indicator MACD is changed to DIF.
  • 💄 Adjust the display of tooltip.
  • 🐞 Fix the problem of incorrect display of the technical indicator RSI after adjusting the parameters.
  • 🐞 Fix the problem of incorrect calculation of the technical indicator VR. The default calculation parameters are changed to [26, 6].
  • 🐞 Fix the display problem of the cross cursor on the mobile.

7.0.0

2021-02-25

  • 🆕 New features
    • Add removeGraphicMark, setGraphicMarkOptions, and createTechnicalIndicator to the chart instance methods.
    • Chart instance methods subscribeDrawAction and unsubscribeDrawAction are changed to subscribeAction and unsubscribeAction, and new types zoom and scroll are added.
    • Add getDistance, getRotatePoint, checkPointOnArc, and getRayLine to the graphics mark auxiliary methods.
    • When creating technical indicators, if it is a new window, you can customize the window id.
    • Built-in technical indicator BOLL, new calculation parameters.
    • When creating a graphic mark, you can customize the id and add event callbacks: onDrawStart, onDrawing, onDrawEnd, onClick, onRightClick, onPressedMove, onRemove.
    • Customize graphic markers, and add batch drawing of conntinuous_line and polygon.
  • 💪 Function enhancement
    • Chart instance method removeTechnicalIndicator, when there is no technical indicator in the window, the window will be automatically removed.
    • The data source volume is no longer an unnecessary field.
    • Customized graphic marking method checkPointOn added parameter key.
  • 💄 Optimize
    • Optimize the sensitivity of checking whether the mouse point is on the drawing module.
    • Optimize the rendering of graphic markers.
    • Optimize the mouse operation of graphic marking.
    • Optimize the display of the cross cursor.
    • Optimize the calculation of technical indicators when data is updated.
  • 👉 Change
    • The chart instance method setTechnicalIndicatorType is changed to createTechnicalIndicator.
    • The chart instance method getTechnicalIndicatorInfo is changed to getTechnicalIndicatorByName.
    • The chart instance method getTechnicalIndicatorType is changed to getTechnicalIndicatorByPaneId.
    • The graphics mark assist method checkPointOnSegmentLine is changed to checkPointOnSegment.
    • Hot key zoom in is changed to shift + +.
    • Hot key zoom out is changed to shift + -.
  • 🐞 Bug fix
    • Fix the problem that the built-in technical indicator VOL, volume prompt does not display.
    • Fix the problem of determining the graphic mark point.
    • Fix the problem that an error may be reported when the comparison type of custom graphics is line.
    • Fix the problem of adding graphic marks and technical indicators globally, which may report errors.
  • 🗑 Delete
    • Delete the chart instance methods createPane, removePane, removeAllGraphicMark.

6.1.0

2021-01-06

  • 🆕 Add extension.addTechnicalIndicator and extension.addGraphicMark to the chart api.
  • 🆕 Each item of the technical indicator plots adds title.
  • 🆕 Add styles for technical indicators.
  • 🆕 Add api overrideTechnicalIndicator, replace the apis setTechnicalIndicatorParams and setTechnicalIndicatorPrecision.
  • 🆕 Add api addCustomGraphicMark to add custom chart mark.
  • 🆕 Add api removePane to remove the window.
  • 🆕 Add configuration graphicMark.polygongraphicMark.arc.
  • 👉 Api getTechnicalIndicatorParams is changed to getTechnicalIndicatorInfo.
  • 👉 Api addGraphicMark is changed to createGraphicMark.
  • 💄 Optimize the display of tooltip.
  • 🐞 Fix method dispose call may report an error problem.
  • 🐞 Fix the problem that the prototype extension may not be compatible with other plugins.
  • 🐞 Fix typescript reference problem.

6.0.5

2020-12-28

  • 🆕 Add configuration candle.margin, candle.tooltip.defaultValue, technicalIndicator.margin, technicalIndicator.tooltip.defaultValue and separator.activeBackgroundColor.
  • 💄 Optimize drag and drop to adjust chart display.
  • 🐞 Fix the problem of custom colors in candle.tooltip.values.

6.0.2

2020-12-17

  • 💄 Optimize the time display of the x-axis cross cursor.
  • 💄 Optimize technical indicator plot type is bar aligned display.
  • 💄 Optimize the display of the highest and lowest prices of candlestick charts.
  • 🐞 Fix the problem that the cross cursor on the mobile terminal needs to be clicked twice for the first time to disappear.

6.0.1

2020-12-06

  • 👉 The minimum drawing pixel of a single data is changed to 1.
  • 💄 Optimize the y-axis display of the secondary fill empty data.
  • 💄 Optimize the calculation of some built-in technical indicators.
  • 🐞 Fix the problem that the same data may cause the y-axis scale to not be calculated.

6.0.0

2020-11-29

  • 🎨 New style configuration
    • 👉 All display is changed to show.
    • 👉 candelStick is changed to candle.
    • 👉 candleStick.bar.style is changed to candle.type.
    • 👉 realTime is changed to candle.area.
    • 👉 floatLayer.prompt.candleStick is changed to candle.tooltip.
    • 👉 floatLayer.prompt.technicalIndicator is changed to technicalIndicator.tooltip.
    • 👉 floatLayer.crossHair is changed to crosshair.
  • 🔧 New API
    • 👉 createTechnicalIndicator is changed to createPane.
    • 👉 setPrecision is changed to setPriceVolumePrecision.
    • 💪 setTechnicalIndicatorType and removeTechnicalIndicator added new parameters and enhanced functions.
    • 🆕 Add getTechnicalIndicatorType.
    • 🗑 Remove setCandleStickChartType.
    • 🗑 Remove setCandleStickTechnicalIndicatorType.
  • 🆕 The main picture and the picture support the setting of multiple technical indicator types.
  • 💄 Optimize initialization method init error parameter prompt.
  • 🐞 Fix the problem that the gap between the name and value of the technical indicator prompt is incorrect.

5.7.0

2020-11-13

  • 🛠 Refactor marking graphics module.
  • 🆕 Configuration item realTime.timeLine.areaFillColor supports gradient.
  • 🆕 Add dataIndex in the callback parameter data of the subscribeDrawAction method.
  • 🆕 Add api setZoomEnabled and isZoomEnabled, setScrollEnabled and isScrollEnabled.
  • 💄 Optimize the chart display of the y-axis value very small.

5.6.0

2020-08-29

  • 🆕 Add render property for custom technical indicators.
  • 🆕 Custom indicator api calcTechnicalIndicator, add parameter plots.
  • 🆕 Add xAxis.height and yAxis.width to configuration items.
  • 🆕 Add api subscribeDrawAction and unsubscribeDrawAction for drawing monitoring and cancellation.
  • 🆕 Add api getTimezone.
  • 👉 Api getTechnicalIndicatorParamOptions changed to getTechnicalIndicatorParams
  • 👉 The built-in indicator text prompt shows that xxxMa is changed to maXxx.
  • 🗑 Remove the configuration item floatLayer.prompt.technicalIndicator.point.

5.5.1

2020-08-16

  • 💄 When there is no data, the y-axis is displayed.
  • 💄 Optimize the default main chart technical indicator type, the default chart is simpler.
  • 💄 Optimize performance and reduce useless calculations.
  • 🐞 Fix the problem that the y-axis cannot be displayed and displayed incorrectly when switching the chart type and the newly added secondary chart indicator.
  • 🐞 Fix the problem that cannot be merged correctly when configuration is a method.
  • 👉 xAxis.tickText.margin changed to xAxis.tickText.paddingTop and xAxis.tickText.paddingBottom.
  • 👉 yAxis.tickText.margin changed to yAxis.tickText.paddingLeft and yAxis.tickText.paddingRight.

5.5.0

2020-07-26

  • 🆕 Add back the technical indicator ohlc display.
  • 🆕 Add text weight configuration.
  • 🆕 A new shouldFormatBigNumber property is added to the custom technical indicators, which is used to inform the chart whether larger numbers need to be formatted.
  • 🆕 New api setTechnicalIndicatorPrecision.
  • 💄 Optimize the data display after moving the mouse over the chart, and display the last data instead.
  • 💄 Optimize the starting position of chart drawing when loading new data.
  • 💄 Optimize the internal dom element level to reduce nesting.
  • 💄 Optimize the prompt text display of VOL.
  • 🐞 Fix the problem that illegal technical indicator calculation parameters may cause the chart to crash.
  • 👉 The style configuration yAxis.tickText.position is changed to yAxis.inside.
  • 👉 The default font family is changed from Arial to Helvetica Neue.
  • 👉 The custom technical indicator attribute isPriceTechnicalIndicator becomes series, and the value is changed to price, volume and normal.
  • 🗑 Remove the x-axis minHeight and maxHeight configuration, change to height adaptive.
  • 🗑 Remove the y-axis minWidth and maxWidth configuration, change to width adaptive.

5.3.0

2020-05-26

  • 🛠 Refactoring technical indicator module.
  • 💄 The optimization method formatDate is called frequently and the resource occupation is too high.
  • 💄 Optimized to load more trigger mechanisms, instead of zooming, scrolling will trigger.
  • 💄 Optimize the Y axis to calculate the maximum and minimum values.
  • 🆕 The new method addCustomTechnicalIndicator is used to add custom technical indicators to the chart.
  • 👉 The method addTechnicalIndicator was changed tocreateTechnicalIndicator.
  • 🗑 Remove the technical indicators and draw ohlc.

5.2.2

2020-05-11

  • 🐞 Solve the problem that some browsers can't render the chart without Intl.

5.2.1

2020-05-09

  • 🐞 Fix the problem that the prompt text of showType: 'rect' is not displayed when the main image is a time-sharing image.
  • 🐞 Fix the problem that the x-axis does not display time when there is only one data.
  • 🐞 Fix the problem that the chart cannot be refreshed accurately when the data changes.
  • 💄 Optimize x-axis split calculation.
  • 💄 Optimized the display of VOL technical indicators.
  • 🆕 The third parameter is added in the addTechnicalIndicator method to set whether the technical indicator graph can be dragged to adjust the height.

5.2.0

2020-04-25

  • 🐞 Fix the problem that the setTimezone method cannot take effect in real time.
  • 🐞 Fix the problem that the entire chart will be exceeded when adjusting the height of the technical indicator chart.
  • 💄 Optimize keyboard events shift + ↑ and shift + ↓ sensitivity.
  • 💄 Optimize the width of the default candlestick.
  • 💄 Optimize the mouse style when the chart is dragged and scrolled.
  • 🆕 The getConvertPictureUrl method adds a new parameter to set the background color of the picture.
  • 🆕 New method setLeftMinVisibleBarCount is used to set the minimum number of bars visible on the left.
  • 🆕 New method setRightMinVisibleBarCount is used to set the minimum number of bars visible on the right.
  • 🆕 Added font style attributes in style configuration.
  • 🆕 Added the final value display configuration of technical indicators.
  • 🆕 Added technical indicator EMA.

5.1.1

2020-04-10

  • 🐞 Fix the issue of invalid method call of removeTechnicalIndicator.
  • 🐞 Fix the problem that the chart cannot fill the root container in some specific cases.
  • 💄 Optimize the minimum width of the candlestick.

5.1.0

2020-03-27

  • 🐞 Fix the problem that setStyleOptions method is called and cannot take effect in real time.
  • 🐞 Fix the problem that the text displayed by the cross cursor is incorrect when the configuration setting {yAxis: {position: 'left'}}.
  • 💄 Optimized drag to adjust the height sensitivity of the technical indicator graph.
  • 🆕 The style configuration adds the current technical indicator value indication point display configuration.
  • 🆕 The style configuration adds a percentage y-axis configuration.

5.0.0

2020-03-25

  • 🛠 The whole chart is refactored, and the new APIs are convenient for expanding functions.
  • 🐞 Fix the mobile terminal zoom event response problem.
  • 💄 Optimize scrolling and zoom fluency.
  • 🆕 The style configuration adds no change color attribute noChangeColor.
  • 🆕 New method setTimezone is used to set the chart time zone.
  • 🆕 New method setPrecision is used to set price and quantity precision.
  • 🆕 The number of technical indicator charts is not limited, and can be added by the method addTechnicalIndicator.
  • 🆕 The technical indicator chart can be adjusted in height by dragging.

4.1.0

2020-01-19

  • 🐞 Fix the display problem when the maximum and minimum values of the y-axis are all 0.
  • 💄 Optimize the default configuration of dashed line parameters and time-sharing line colors.
  • 💄 Optimized the problem that the chart will scroll up and down when scrolling on individual wheels.
  • 💄 Optimize indicator calculation and call logic to reduce useless method calls.

4.0.0

2019-12-30

  • 🐞 Fix the problem of merge method that cannot merge data correctly.
  • 💄 Optimize the height of the default technical indicator graph.
  • 🆕 New method loadMore is used to load historical data in sections.
  • 🆕 Added keyboard shortcuts shift + ←, shift + →, shift + ↑, shift + ↓ for zooming and scrolling.
  • 🆕 Added the function of setting technical index calculation parameters.
  • 🆕 Added technical indicator SAR.

3.0.0

2019-12-16

  • 🆕 Support technical indicators.
  • 🆕 Support custom styles.
  • 🆕 Support mobile devices.