📊 CSV to DataTable Generator
Transform your CSV files into beautiful, interactive HTML tables with advanced features and stunning themes.
![]()
![]()
✨ Features
- 🎨 5 Beautiful Themes - Dark, Light, Neon, Purple, and Ocean
- 🔍 Advanced Search - Real-time filtering across all columns
- 📑 Smart Pagination - Customizable page sizes
- ↕️ Column Sorting - Click any header to sort
- 📤 Export Options - Copy, CSV, Excel, PDF, and Print
- 📱 Responsive Design - Works on all screen sizes
- 🔒 Fixed First Column - Always visible while scrolling
- 💾 Persistent State - Remembers your settings
- ⚡ Lightning Fast - Handles large datasets efficiently
- 🎯 Zero Configuration - Works out of the box
- 📥 stdin Support - Pipe data directly from other commands
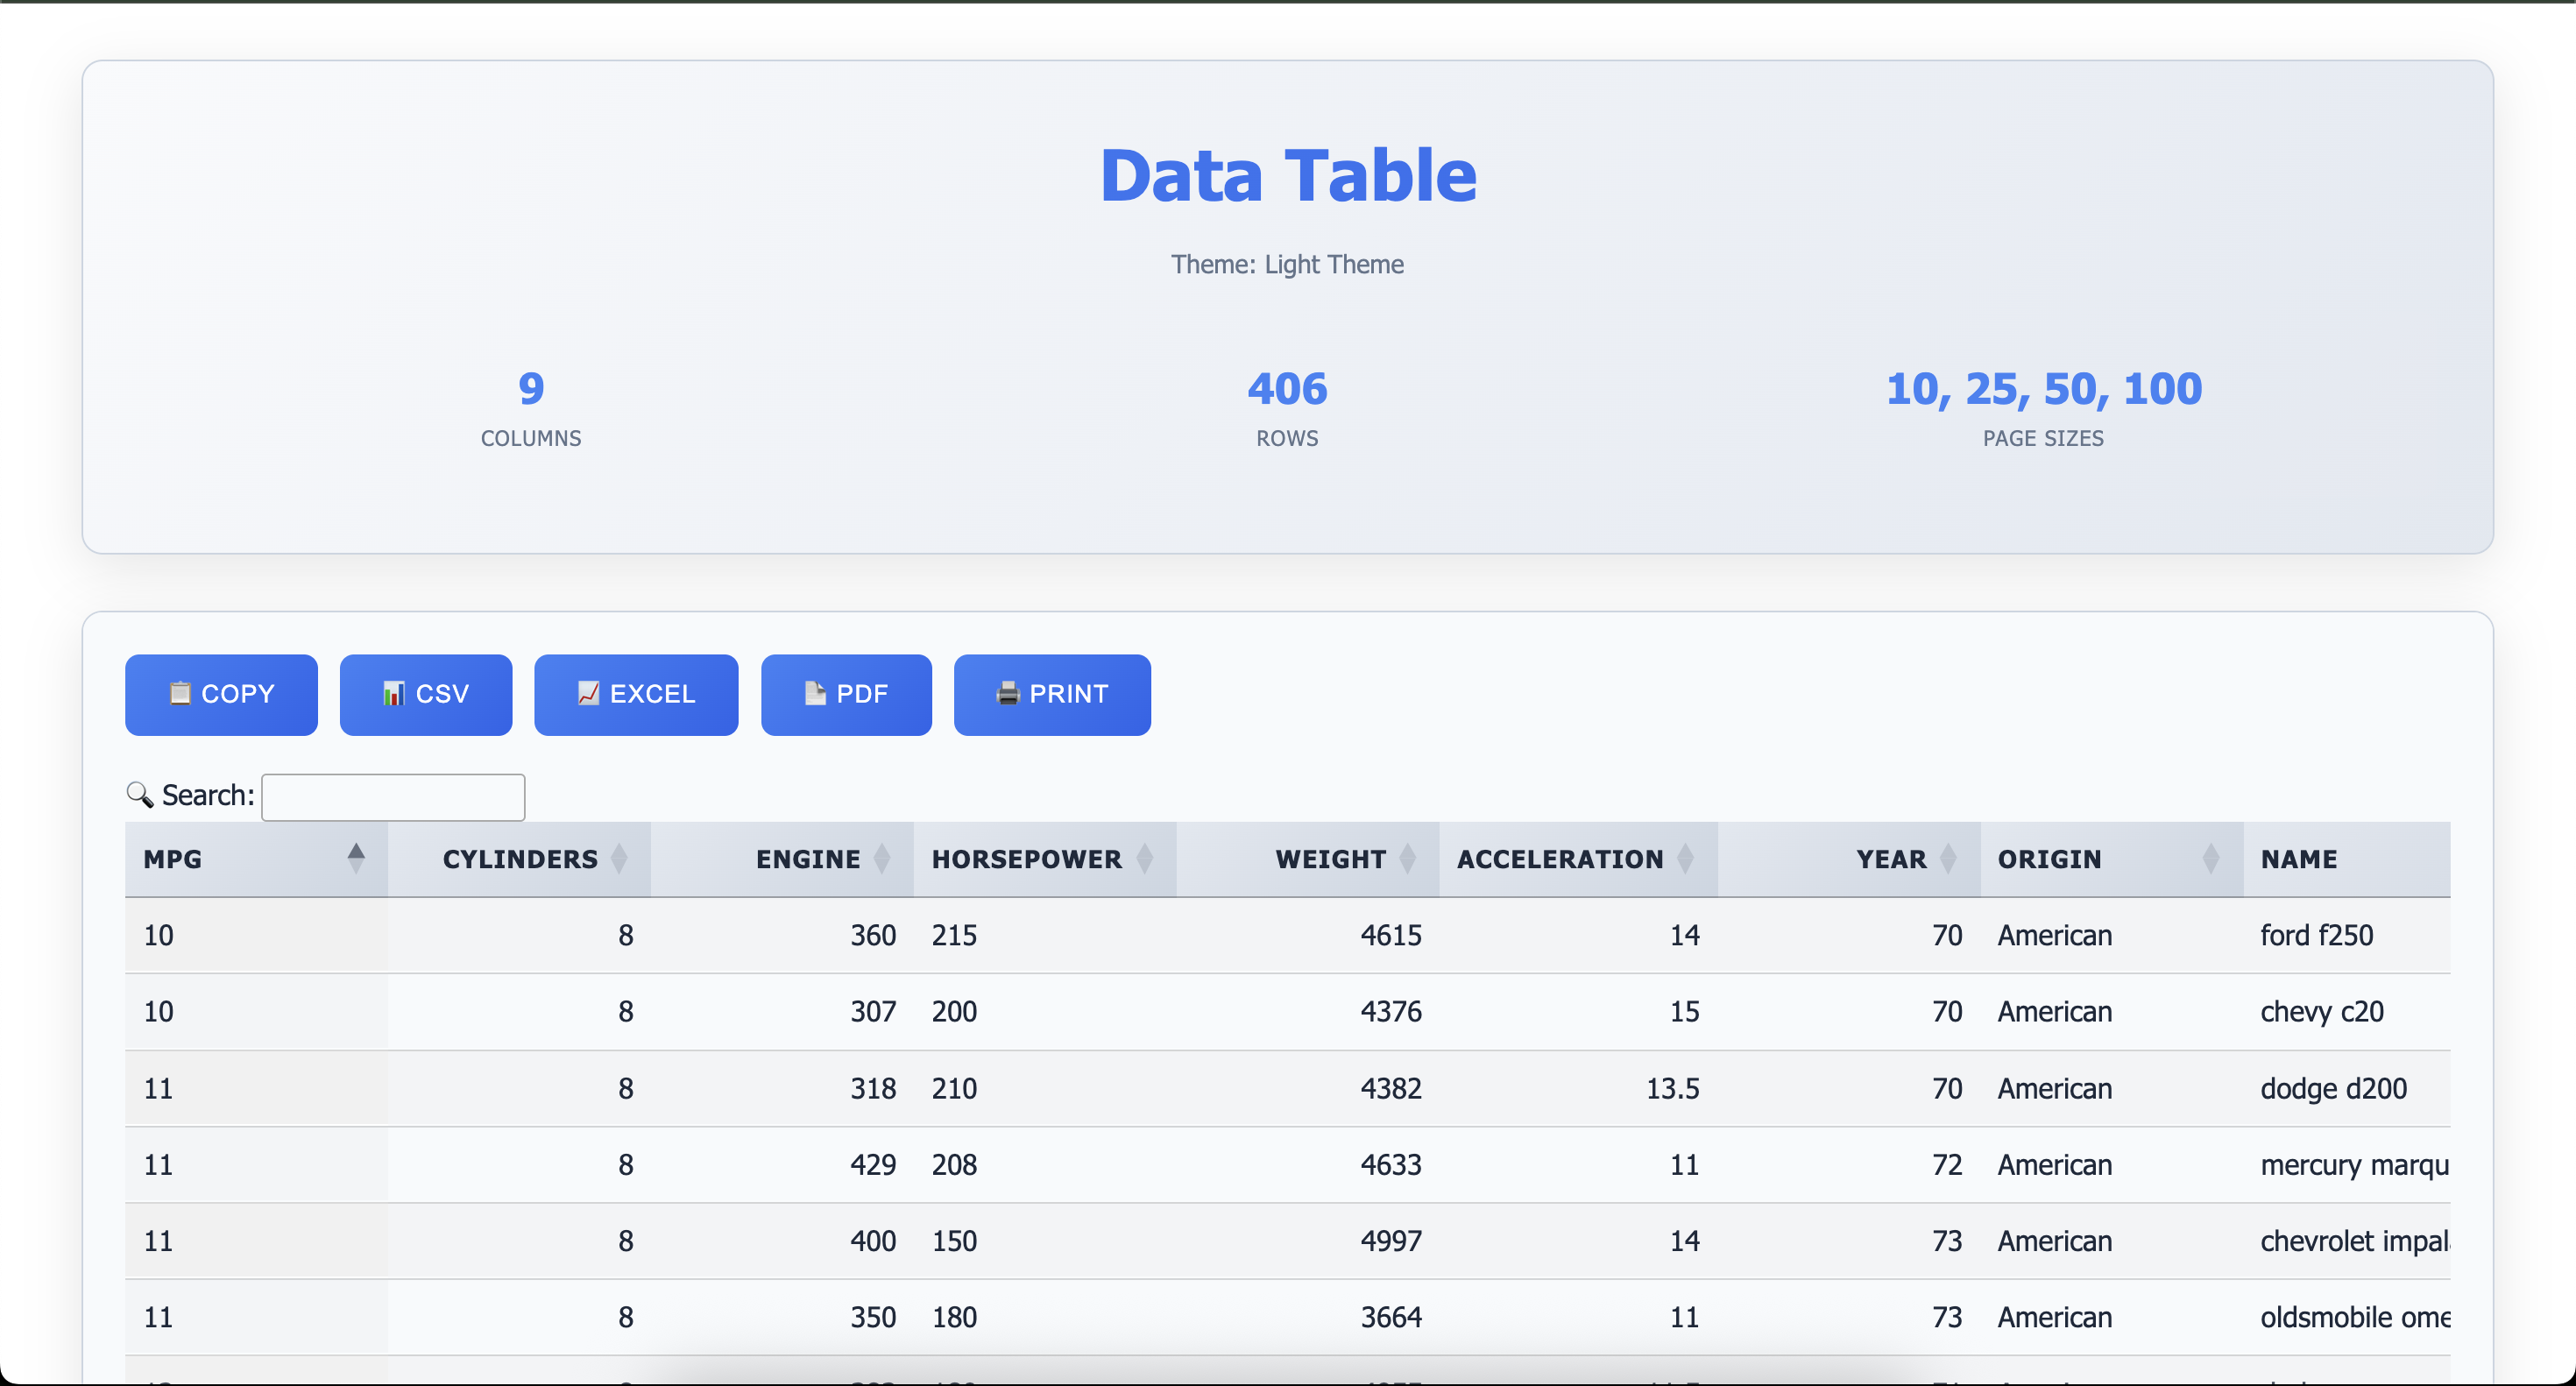
Screenshot
📦 Installation
Global Installation (Recommended)
npm install -g csv-to-datatable🚀 Quick Start
Basic Usage
# From a file
csv-datatable data.csv

# From stdin
cat data.csv | csv-datatable

# From a command
curl https://example.com/data.csv | csv-datatable -T neon
This generates table.html with default dark theme and opens it in your browser.
With Options
csv-datatable sales.csv -t "Sales Report 2024" -T light -p 50 -s "25,50,100,200"📖 Command-Line Options
Input Methods
The tool supports three ways to provide CSV data:
- Positional argument:
csv-datatable data.csv - File flag:
csv-datatable -f data.csv - stdin (pipe):
cat data.csv | csv-datatable
Positional Argument
| Argument | Description | Required |
|---|---|---|
[file] |
Input CSV file path | Optional with stdin |
Options
| Option | Alias | Description | Default |
|---|---|---|---|
-f, --file <path> |
| Input CSV file (alternative to positional arg) | - | |
-t, --title <title> |
| Title for the table | "Data Table" |
|
-T, --theme <theme> |
| Theme: dark, light, neon, purple, ocean | dark |
|
-o, --output <path> |
| Output HTML file path | table.html |
|
-p, --page-length <number> |
| Default page length | 25 |
|
-s, --page-sizes <sizes> |
| Available page sizes (comma-separated) | 10,25,50,100 |
|
--enable-search |
| Enable global search | true |
|
--enable-sort |
| Enable column sorting | true |
|
--responsive |
| Enable responsive design | true |
🎨 Available Themes
Dark Theme (Default)
csv-datatable data.csv -T darkProfessional dark theme with blue accents. Perfect for long reading sessions.
Light Theme
csv-datatable data.csv -T lightClean, bright theme ideal for presentations and printing.
Neon Theme
csv-datatable data.csv -T neonCyberpunk-inspired with neon green and hot pink accents.
Purple Theme
csv-datatable data.csv -T purpleElegant purple gradient theme with a mystical feel.
Ocean Theme
csv-datatable data.csv -T oceanRefreshing ocean-blue theme with aqua accents.
💡 Usage Examples
Example 1: Simple Report
csv-datatable customers.csv -t "Customer List"Example 2: Sales Dashboard
csv-datatable sales_2024.csv \
  -t "Q4 Sales Report" \
  -T ocean \
  -p 50 \
  -s "25,50,100,200" \
  -o sales-dashboard.html
Example 3: Large Dataset
csv-datatable bigdata.csv \
  -p 100 \
  -s "50,100,200,500,-1" \
  -T dark
Note: Use -1 in page sizes to include "All" option
Example 4: Light Theme for Printing
csv-datatable invoice.csv \
  -t "Invoice Details" \
  -T light \
  -o invoice.html
Example 5: Compact View
csv-datatable contacts.csv \
  -p 10 \
  -s "5,10,20,50"
Example 6: Piping from Commands
# From cat
cat data.csv | csv-datatable -T neon -o output.html

# From curl
curl https://example.com/api/export.csv | csv-datatable -t "Remote Data"

# From cut (filter columns)
cut -d',' -f1,2,3 data.csv | csv-datatable -t "Selected Columns"

# From grep (filter rows)
grep "Active" customers.csv | csv-datatable -t "Active Customers"
Example 7: Salesforce Data Query
# Query Salesforce and visualize results
sf data query -q "SELECT Id, Name FROM Account" -o username -r csv | csv-datatable -T dark

# With custom title and theme
sf data query -q "SELECT Id, Name, Industry, AnnualRevenue FROM Account LIMIT 100" \
  -o myorg -r csv | \
  csv-datatable -t "Salesforce Accounts" -T ocean -p 50

# Query and save to custom file
sf data query -q "SELECT Id, Name, Email, Phone FROM Contact WHERE Email != null" \
  -o username -r csv | \
  csv-datatable -t "Contacts with Email" -T purple -o contacts-report.html
Example 8: Database Export
# PostgreSQL
psql -d mydb -c "COPY (SELECT * FROM users) TO STDOUT CSV HEADER" | \
  csv-datatable -t "User Database" -T dark

# MySQL
mysql -u user -p database -e "SELECT * FROM products" -B | \
  sed 's/\t/,/g' | \
  csv-datatable -t "Product Catalog" -T light
Example 9: Log Analysis
# Parse and visualize logs
cat access.log | awk '{print $1","$4","$7}' | csv-datatable -t "Access Logs"

# With preprocessing
grep "ERROR" app.log | cut -d' ' -f1,2,5 | tr ' ' ',' | \
  csv-datatable -t "Error Log" -T neon
Example 10: API Data Processing
# Fetch JSON, convert to CSV, visualize
curl https://api.example.com/data | \
  jq -r '.[] | [.id, .name, .value] | @csv' | \
  csv-datatable -t "API Data" -T purple
📊 Features Breakdown
🔍 Search & Filter
- Global Search: Search across all columns instantly
- Real-time Results: See results as you type
- Keyboard Shortcut: Press
Ctrl/Cmd + Fto focus search
📑 Pagination
- Customizable Sizes: Set your own page size options
- Quick Navigation: First, Previous, Next, Last buttons
- Status Info: Shows "Showing X to Y of Z entries"
- Smart Display: Ellipsis for large page ranges
↕️ Sorting
- Multi-column: Click any header to sort
- Toggle Direction: Click again to reverse sort
- Visual Indicators: Arrows show current sort state
📤 Export Functions
- 📋 Copy: Copy table data to clipboard
- 📊 CSV: Export as CSV file
- 📈 Excel: Export as Excel spreadsheet
- 📄 PDF: Generate PDF (landscape, A2 size)
- 🖨️ Print: Print-optimized view
🎯 Advanced Features
- Fixed First Column: Always visible when scrolling horizontally
- Sticky Headers: Headers stay visible when scrolling vertically
- Cell Tooltips: Hover to see full content of truncated cells
- Responsive Tables: Adapts to screen size
- Keyboard Navigation: Full keyboard support
- stdin Support: Seamlessly integrate with command pipelines
🗂️ CSV Format Requirements
Supported Format
Header1,Header2,Header3
Value1,Value2,Value3
Value4,Value5,Value6
Best Practices
- ✅ First row should contain headers
- ✅ Use UTF-8 encoding
- ✅ Quote fields containing commas:
"Last, First" - ✅ Escape quotes with double quotes:
"He said ""Hello""" - ✅ Keep headers concise and descriptive
File Size Recommendations
- Small (< 1MB): Any page size works
- Medium (1-10MB): Use page sizes 25-100
- Large (> 10MB): Use page sizes 50-200
🎯 Use Cases
- 📈 Data Analysis: Quickly visualize CSV exports
- 📊 Reports: Generate beautiful HTML reports
- 📋 Inventory: Display product catalogs
- 👥 Contact Lists: Manage customer databases
- 💰 Financial Data: Present sales and revenue
- 📚 Education: Share student records
- 🔬 Research: Display experimental data
- 📦 Logistics: Track shipments and orders
- 🔌 Salesforce: Visualize SOQL query results
- 🗄️ Database Exports: View database query results
- 📊 API Responses: Convert JSON/API data to tables
- 📝 Log Analysis: Visualize parsed log files
🛠️ Technical Details
Dependencies
- DataTables.js v2.0.8 - Table enhancement
- jQuery v3.7.1 - DOM manipulation
- Papa Parse - CSV parsing
- Commander - CLI argument parsing
- JSZip - Excel export support
- PDFMake - PDF generation
Browser Compatibility
- ✅ Chrome 90+
- ✅ Firefox 88+
- ✅ Safari 14+
- ✅ Edge 90+
Performance
- Load Time: < 2s for files up to 5MB
- Search: Real-time with < 50ms delay
- Export: < 5s for 10,000 rows
🔧 Advanced Usage
Custom Page Sizes
# Small increments for detailed analysis
csv-datatable data.csv -s "5,10,15,20"

# Large increments for quick overview
csv-datatable data.csv -s "100,250,500,1000"

# Include "Show All" option
csv-datatable data.csv -s "25,50,100,-1"
Piping Workflows
Data Transformation Pipeline
# Extract, transform, and visualize in one go
cat raw_data.csv | \
  grep -v "^#" | \
  cut -d',' -f1,3,5 | \
  sort -t',' -k2 | \
  csv-datatable -t "Processed Data" -T ocean
Multi-stage Processing
# Download, filter, and visualize
curl -s https://api.example.com/export.csv | \
  grep "2024" | \
  csv-datatable -t "2024 Data" -T purple -o report.html
Database to Web Report
# One-line database report generation
psql -d production -t -A -F"," \
  -c "SELECT * FROM sales WHERE date > '2024-01-01'" | \
  csv-datatable -t "Sales Report Q1 2024" -T light -p 100
Real-World Examples
Customer Database
csv-datatable customers.csv \
  -t "Customer Database - 2024" \
  -T light \
  -p 25 \
  -s "10,25,50,100" \
  -o customers-report.html
Financial Report
csv-datatable transactions.csv \
  -t "Q4 Financial Transactions" \
  -T purple \
  -p 50 \
  -s "25,50,100,200" \
  -o finance-report.html
Product Catalog
csv-datatable products.csv \
  -t "Product Catalog 2024" \
  -T ocean \
  -p 20 \
  -s "10,20,50,100,-1"
Salesforce Account Analysis
sf data query \
  -q "SELECT Id, Name, Industry, Type, AnnualRevenue, NumberOfEmployees FROM Account WHERE Industry != null ORDER BY AnnualRevenue DESC LIMIT 500" \
  -o myorg -r csv | \
  csv-datatable -t "Top Accounts by Revenue" -T dark -p 50 -o accounts-analysis.html
📄 License
This project is licensed under the MIT License - see the LICENSE file for details.
🙏 Acknowledgments
- DataTables - Amazing table plugin
- Papa Parse - Fast CSV parser
- Commander.js - CLI framework
- jQuery - JavaScript library
🗺️ Roadmap
- <input checked="" disabled="" type="checkbox"> stdin support for piping
- <input disabled="" type="checkbox"> Add column filtering
- <input disabled="" type="checkbox"> Support for JSON input
- <input disabled="" type="checkbox"> Custom column width control
- <input disabled="" type="checkbox"> Chart integration
- <input disabled="" type="checkbox"> Row grouping
- <input disabled="" type="checkbox"> Column visibility toggle
- <input disabled="" type="checkbox"> Save/load table state
- <input disabled="" type="checkbox"> Dark mode toggle button
- <input disabled="" type="checkbox"> More export formats (XML, SQL)
- <input disabled="" type="checkbox"> API endpoint generation
Made with ❤️ for data enthusiasts
🎓 Tutorial
Step 1: Prepare Your CSV
Name,Email,Department,Salary
John Doe,john@example.com,Engineering,120000
Jane Smith,jane@example.com,Marketing,95000
Step 2: Generate Table
csv-datatable employees.csv -t "Employee Directory"Step 3: Customize
csv-datatable employees.csv \
  -t "Employee Directory" \
  -T purple \
  -p 10 \
  -s "5,10,20,50"
Step 4: Use with Pipes (Optional)
# Direct from command output
cat employees.csv | csv-datatable -t "Employee Directory" -T purple

# From remote source
curl https://company.com/employees.csv | csv-datatable -t "Remote Employees"

# From Salesforce
sf data query -q "SELECT Name, Email, Department FROM Employee__c" \
  -o myorg -r csv | \
  csv-datatable -t "Salesforce Employees" -T ocean
Step 5: Share
Share the generated HTML file with your team - no server required!
📱 Mobile Support
The tables are fully responsive and work great on mobile devices:
- Horizontal scrolling for wide tables
- Touch-friendly controls
- Optimized button sizes
- Responsive page size selector
Try it on your phone! 📱
🔗 Integration Examples
Shell Scripts
#!/bin/bash
# Generate daily report
sf data query -q "SELECT Id, Name, Status FROM Case WHERE CreatedDate = TODAY" \
  -o production -r csv | \
  csv-datatable -t "Daily Cases - $(date +%Y-%m-%d)" -T dark -o "reports/daily-$(date +%Y%m%d).html"
Cron Jobs
# Add to crontab for automated reports
0 9 * * * /usr/local/bin/sf data query -q "SELECT * FROM DailyMetrics__c" -o myorg -r csv | /usr/local/bin/csv-datatable -t "Daily Metrics" -o /var/www/html/reports/daily.html
CI/CD Pipeline
# GitHub Actions example
- name: Generate Report
  run: |
    sf data query -q "SELECT * FROM TestResults__c" -o ci-org -r csv | \
    csv-datatable -t "Test Results" -T light -o test-report.html

- name: Upload Report
  uses: actions/upload-artifact@v2
  with:
    name: test-report
    path: test-report.html
Last Updated: January 8, 2026