udm-chart Chart Library for Angular6 by TypeScript2
![]()
udm-chart is a chart library using d3.js (version 4) for Angular6 written by TypeScript2.
Test Project for This Library, https://github.com/Ohtsu/UdmChartTest/
Video Explanation (English), https://www.udemy.com/angular5-custom-library-the-definitive-step-by-step-guide/
Video Explanation (Japanese), https://www.udemy.com/angular5-l/
Overview
- udm-chart is a wrapper library of d3.js (version 4) for Angular6
12 main charts are supported
(Line,Bar,Pie,ScatterPlot,Histogram,Stack Bar, Geo Map, Geo Orthographic, Tree, Pack Layout, Choropleth,Force)
Axis
You can include axis automatically by the configuration file.
Legend
You can include legend automatically by the configuration file.
Animation
You can animate such charts as Bar, Pie, Histogram, Stack Bar,Geo Orthographic and Pack Layout charts by the configuration file.
Prerequisite
- node.js
- Typescript2
- Angular6
Installation
To install this consumer project, run simply:
$ npm install Start project
If you start local server as follows, you can get many kinds of charts in your browser.
$ ng serve -oVersion
- udm-chart-test : 0.5
- ng6-udm-chart : 0.5
- Angular6 : 6.0.0
- TypeScript : 2.7.2
- d3.js : 4.3.0
Reference
"Angular 5, Angular 6 Custom Library: Step-by-step guide", https://www.udemy.com/angular5-custom-library-the-definitive-step-by-step-guide/
"Discount Coupon Code (until 2018.7.12)", https://www.udemy.com/angular5-custom-library-the-definitive-step-by-step-guide/?couponCode=CUSTLIB-EN-20180713
"Angular 5, Angular 6用 カスタムライブラリの作成: 完全ステップ・バイ・ステップ・ガイド", https://www.udemy.com/angular5-l/
"ディスカウント・クーポン(2018.7.12まで)", https://www.udemy.com/angular5-l/?couponCode=NG5-CUSLIB-JA-0712
"データビジュアライゼーションのためのD3.js徹底入門 Webで魅せるグラフ&チャートの作り方",2014/6/6,by 古籏 一浩, http://www.amazon.co.jp/s/ref=nb_sb_noss?__mk_ja_JP=%E3%82%AB%E3%82%BF%E3%82%AB%E3%83%8A&url=search-alias%3Daps&field-keywords=ISBN978-4-7973-6886-4&rh=i%3Aaps%2Ck%3AISBN978-4-7973-6886-4
"D3.js by Example",2015/12/29,by Michael Heydt http://www.amazon.co.jp/s/ref=nb_sb_noss?__mk_ja_JP=%E3%82%AB%E3%82%BF%E3%82%AB%E3%83%8A&url=search-alias%3Daps&field-keywords=ISBN978-1-78528-008-5&rh=i%3Aaps%2Ck%3AISBN978-1-78528-008-5
"Mastering D3.js",2014/8/25,by Pablo Navarro, http://www.amazon.co.jp/s/ref=nb_sb_noss?__mk_ja_JP=%E3%82%AB%E3%82%BF%E3%82%AB%E3%83%8A&url=search-alias%3Daps&field-keywords=ISBN978-1-78328-627-0&rh=i%3Aaps%2Ck%3AISBN978-1-78328-627-0
"Data Visualization With D3 and Angularjs",2015/4/27,by Christoph Korner, http://www.amazon.co.jp/s/ref=nb_sb_noss?__mk_ja_JP=%E3%82%AB%E3%82%BF%E3%82%AB%E3%83%8A&url=search-alias%3Daps&field-keywords=ISBN978-1-78439-848-4&rh=i%3Aaps%2Ck%3AISBN978-1-78439-848-4
"Mastering TypeScript",2015/4/23,by Nathan Rozentals, http://www.amazon.co.jp/s/ref=nb_sb_noss?__mk_ja_JP=%E3%82%AB%E3%82%BF%E3%82%AB%E3%83%8A&url=search-alias%3Daps&field-keywords=ISBN978-1-78439-966-5&rh=i%3Aaps%2Ck%3AISBN978-1-78439-966-5
"D3 Tips and Tricks v4.x",by Malcolm Maclean,Leanpub, https://leanpub.com/d3-t-and-t-v4/read
Change Log
- 2018.6.20 version 0.3 uploaded
Copyright
copyright 2018 by Shuichi Ohtsu (DigiPub Japan)
License
MIT © Shuichi Ohtsu
Step by Step Intallation of udm-chart
Video Explanation (English), https://www.udemy.com/angular5-custom-library-the-definitive-step-by-step-guide/
Video Explanation (Japanese), https://www.udemy.com/angular5-l/
Install @angular/cli
$ npm install -g @angular/cliCreate New Project
$ ng new sample-chart (Your project name)
$ cd sample-chart
Check Your Program
If you start local server as follows, you can get the first page in your browser by accessing http://localhost:4200.
$ ng serve -oFirst Page

Stop Local Server
Input Ctrl+C and y+Return to stop the local server.
Install d3.js and ng6-udm-chart
$ npm install d3@4.3.0 --save
$ npm install ng6-udm-chart --save
Modify app.module.ts
$ cd src/appChange directory to "src/app", you will find app.module.ts. Modify this file as follows.
import { BrowserModule } from '@angular/platform-browser';
import { NgModule } from '@angular/core';

import { AppComponent } from './app.component';
import { Ng6UdmChartModule } from 'ng6-udm-chart';  // <= Add

@NgModule({
  declarations: [
    AppComponent
  ],
  imports: [
    BrowserModule,
    Ng6UdmChartModule   // <= Add
  ],
  providers: [],
  bootstrap: [AppComponent]
})
export class AppModule { }
Modify app.component.ts
In the same directory, modify app.component.ts as follows.
import { Ng6UdmChartModule } from 'ng6-udm-chart';
import { Component } from '@angular/core';
import * as ChartConst from 'ng6-udm-chart';
@Component({
selector: 'app-root',
templateUrl: './app.component.html',
styleUrls: ['./app.component.css']
})
export class AppComponent {
title = 'app';
// Add Start --------------------------------------------
chartType:string;
configData:any;
barDataJson:any;
geoMapDataJson:any;
geoOrthographicDataJson:any;
choroplethDataJson:any;
scatterPlotDataJson:any;
lineDataJson:any;
histogramDataJson:any;
pieDataJson:any;
packLayoutDataJson:any;
treeMapDataJson:any;
stackBarDataJson:any;
treeDataJson:any;
forceDataJson:any;
DataSetJson:string;
lineTypeName:string;
barTypeName: string;
pieTypeName:string;
scatterPlotTypeName:string;
histogramTypeName:string;
stackBarTypeName:string;
geoMapTypeName:string;
geoOrthographicTypeName:string;
treeMapTypeName:string;
packLayoutTypeName:string;
choroplethTypeName:string;
treeTypeName:string;
forceTypeName:string;
constructor() {
this.barTypeName = ChartConst.LINE_CHART_TYPE_NAME;
this.lineTypeName = ChartConst.LINE_CHART_TYPE_NAME;
this.barTypeName = ChartConst.BAR_CHART_TYPE_NAME;
this.pieTypeName = ChartConst.PIE_CHART_TYPE_NAME;
this.scatterPlotTypeName = ChartConst.SCATTER_PLOT_CHART_TYPE_NAME;
this.histogramTypeName = ChartConst.HISTOGRAM_CHART_TYPE_NAME;
this.stackBarTypeName = ChartConst.STACK_BAR_CHART_TYPE_NAME;
this.geoMapTypeName = ChartConst.GEO_MAP_CHART_TYPE_NAME;
this.geoOrthographicTypeName= ChartConst.GEO_ORTHOGRAPHIC_CHART_TYPE_NAME;
this.treeMapTypeName = ChartConst.TREE_MAP_CHART_TYPE_NAME;
this.packLayoutTypeName = ChartConst.PACK_LAYOUT_CHART_TYPE_NAME;
this.choroplethTypeName = ChartConst.CHOROPLETH_CHART_TYPE_NAME;
this.treeTypeName = ChartConst.TREE_CHART_TYPE_NAME;
this.forceTypeName = ChartConst.FORCE_CHART_TYPE_NAME;
this.initilizeData();
}
private initilizeData() {
// ConfigData = this.httpClient.get('assets/json/ConfigData.json');
this.configData = {
// tslint:disable-next-line:quotemark
"className": {
'axis': 'axis',
'axisXBorder': 'axis_x',
'axisXText': 'axis-x-text',
'bar': 'bar',
'barValue': 'bar-value',
'line': 'line',
'multiLinePrefix': 'line-',
'grid': 'grid',
'pie': 'pie',
'pieInnerTitle': 'pie-inner-title',
'pieInnerRadius': 'total',
'histogram': 'histogram',
'histogramBar': 'histogram-bar',
'treemap': 'treemap',
'treemapLabel': 'treemap-label',
'packlayout': 'packlayout',
'packlayoutLabel': 'packlayout-label',
},
'label': {
'display': true,
},
'title': {
'display': true,
'name': 'Title',
'className': 'chart-title',
'height': 30,
'leftMargin': -20,
'bottomMargin': 10
},
'maxValue': {
'auto': true,
'x': 100,
'y': 100,
},
'legend': {
'display': true,
'position': 'right',
'totalWidth': 80,
'initXPos': 5,
'initYPos': 10,
'rectWidth': 10,
'rectHeight': 10,
'xSpacing': 2,
'ySpacing': 2
},
'color': {
'auto': true, //
'defaultColorNumber': 10,
'opacity': 1.0,
'userColors': [
'blue',
'red',
'green',
'yellow',
'PaleGoldenrod',
'Khaki',
'DarkKhaki',
'Gold',
'Cornsilk',
'BlanchedAlmond',
'Bisque',
'NavajoWhite',
'Wheat',
'BurlyWood',
'Tan',
'RosyBrown',
'SandyBrown',
'Goldenrod',
'DarkGoldenrod',
'Peru',
'Chocolate'
],
'focusColor': 'red',
},
'pie': {
'innerRadius': {
'percent': 20,
'title': 'Total'
},
'value': {
'display': true,
},
'percent':{
'display': false,
}
},
'line': {
'legend': 'lineEnd',
'interpolate' : 'linear',
},
'grid': {
'x': {
'display': true,
},
'y':{
'display': true,
},
},
'margin': {
'top': 30,
'left': 30,
'right': 10,
'bottom': 20,
'between': 5
},
'axis': {
'rotation': 0,
'borderLineWidth': 1,
'xLabel': {
'leftMargin': 0,
'bottomMargin': 5
},
'yLabel':{
'leftMargin': 0,
'bottomMargin': 0
},
},
'animation':{
'enable':true,
'duration':4000,
},
};
this.barDataJson =
{
'series':[
'English',
'Math'
],
'data':[
{
'x': 'suzuki',
'y': [92,73],
},
{
'x': 'inoue',
'y': [69,45],
},
{
'x': 'sato',
'y': [70,100],
},
{
'x': 'tanaka',
'y': [43,66],
},
{
'x': 'ida',
'y': [60,70],
},
{
'x': 'kato',
'y': [55,63],
},
],
};
this.lineDataJson = {
'series':[
'year',
'sell',
],
'data':[
{
'name': 'software',
'value':[
{
'x':'2010',
'y':18
},
{
'x':'2011',
'y':22
},
{
'x':'2012',
'y':30
},
{
'x':'2013',
'y':31
},
]
},
{
'name': 'hardware',
'value':[
{
'x':'2010',
'y':15
},
{
'x':'2011',
'y':16
},
{
'x':'2012',
'y':10
},
{
'x':'2013',
'y':21
},
]
},
{
'name': 'device',
'value':[
{
'x':'2010',
'y':25
},
{
'x':'2011',
'y':26
},
{
'x':'2012',
'y':30
},
{
'x':'2013',
'y':31
},
]
},
{
'name': 'others',
'value':[
{
'x':'2010',
'y':100
},
{
'x':'2011',
'y':16
},
{
'x':'2012',
'y':20
},
{
'x':'2013',
'y':41
},
]
},
],
};
this.geoOrthographicDataJson =
{
'map':{
'baseGeoDataUrl': 'https://raw.githubusercontent.com/Ohtsu/data/master/o2-chart/world.geojson',
'keyDataName':'features',
'targetPropertyName':'properties.name',
'scale':160,
'colorNumber':10,
'rotate':{
'horizontal':210,
'vertical':5
},
'clipAngle':90,
'oceanColor':'navy',
'antarcticaColor':'white',
},
'data':[
{
'name':'Australia',
'color':'red'
},
{
'name':'Antarctica',
'color':'white'
},
{
'name':'Japan',
'color':'teal'
},
]
}
this.geoMapDataJson =
{
'map':{
'baseGeoDataUrl':'https://raw.githubusercontent.com/Ohtsu/data/master/o2-chart/world.geojson',
'scale':75,
'keyDataName':'features',
'targetPropertyName':'properties.name',
},
'data':[
{
'name':'Australia',
'color':'red'
},
{
'name':'Antarctica',
'color':'white'
},
{
'name':'Japan',
'color':'blue'
},
],
};
this.stackBarDataJson =
{
'config':{
'timeFormat':'%Y',
},
'series':[
'year',
'sell',
],
'data':[
{
'name': 'software',
'value':[
{
'x':'2010',
'y':18
},
{
'x':'2011',
'y':22
},
{
'x':'2012',
'y':30
},
{
'x':'2013',
'y':31
},
]
},
{
'name': 'hardware',
'value':[
{
'x':'2010',
'y':15
},
{
'x':'2011',
'y':16
},
{
'x':'2012',
'y':10
},
{
'x':'2013',
'y':21
},
]
},
{
'name': 'device',
'value':[
{
'x':'2010',
'y':25
},
{
'x':'2011',
'y':26
},
{
'x':'2012',
'y':30
},
{
'x':'2013',
'y':31
},
]
},
{
'name': 'others',
'value':[
{
'x':'2010',
'y':5
},
{
'x':'2011',
'y':16
},
{
'x':'2012',
'y':20
},
{
'x':'2013',
'y':41
},
]
},
],
};
this.scatterPlotDataJson =
{
'series':[
'seriesA',
'seriesB',
'seriesC'
],
'data':[
{
'name': 'suzuki',
'value':[
{'x':30,'y':40,'r':5},
{'x':120,'y':115,'r':10},
{'x':125,'y':90,'r':2},
{'x':150,'y':160,'r':1},
{'x':150,'y':160,'r':3},
{'x':128,'y':215,'r':5},
{'x':130,'y':40,'r':15},
{'x':220,'y':115,'r':25},
]
},
{
'name': 'inoue',
'value':[
{'x':130,'y':140,'r':5},
{'x':20,'y':15,'r':10},
{'x':25,'y':190,'r':2},
{'x':250,'y':60,'r':1},
{'x':50,'y':60,'r':3},
{'x':28,'y':15,'r':5},
{'x':230,'y':140,'r':15},
{'x':20,'y':215,'r':25},
]
},
],
};
this.histogramDataJson =
{
'range':[0,100],
'bins': [0,10,20,30,40,50,60,70,80,90,100],
'data':[
50,95,60,44,60,50,35,20,10,8,
56,70,65,42,22,33,40,53,52,89,
90,55,50,55,65,72,45,35,15,45,
50,95,60,44,60,50,35,20,10,8,
56,70,65,42,22,33,40,53,52,89,
90,55,50,55,65,72,45,35,15,45,
50,95,60,44,60,50,35,20,10,8,
56,70,65,42,22,33,40,53,52,89,
90,55,50,55,65,72,45,35,15,45,
],
};
this.packLayoutDataJson = {
'name':'United States', 'value' :281421906,
'children' : [
{'name':'California', 'value' :33871648},
{'name':'Texas', 'value' :20851820},
{'name':'New York', 'value' :18976457},
{'name':'Florida', 'value' :15982378},
{'name':'Illinois', 'value' :12419293},
{'name':'Pennsylvania', 'value' :12281054},
{'name':'Ohio', 'value' :11353140},
]
}
this.treeDataJson =
{
'name': 'Eve',
'children': [
{ 'name': 'Cain'
},
{
'name': 'Seth',
'children': [
{ 'name': 'Enos' },
{ 'name': 'Noam' }
]
},
{ 'name': 'Abel'
},
{
'name': 'Awan',
'children': [
{ 'name': 'Enoch' }
]
},
{ 'name': 'Azura'
},
]
};
this.treeMapDataJson = {
'name': 'Root',
'children': [
{ 'name': 'Dir1', 'children': [
{ 'name': 'Dir2', 'children': [
{ 'name': 'FileA', value: 5000 },
{ 'name': 'FileB', value: 3000 },
{ 'name': 'Dir3', 'children': [
{ 'name': 'FileC', value: 2000 },
{ 'name': 'Dir4', 'children': [
{ 'name': 'FileD', value: 1000 },
{ 'name': 'FileE', value: 1500 }
]
}
]
}
]
}
]
}
]
}
this.choroplethDataJson = {
'map':{
'baseGeoDataUrl':'https://raw.githubusercontent.com/Ohtsu/data/master/o2-chart/japan.geojson',
'scale':900,
'center':[137.571,37.500],
'startColor':'blue',
'endColor':'red',
'colorNumber':10,
'keyDataName':'features',
'targetPropertyName':'properties.id'
},
'data':
[
{
'id':1,
'value':7.12
},
{
'id':2,
'value':8.97
},
{
'id':3,
'value':7.07
},
{
'id':4,
'value':7.78
},
{
'id':5,
'value':6.97
},
{
'id':6,
'value':5.79
},
{
'id':7,
'value':7.14
},
{
'id':8,
'value':6.68
},
{
'id':9,
'value':6.28
},
{
'id':10,
'value':6.32
},
{
'id':11,
'value':6.29
},
{
'id':12,
'value':6.14
},
{
'id':13,
'value':5.87
},
{
'id':14,
'value':5.75
},
{
'id':15,
'value':5.50
},
{
'id':16,
'value':5.21
},
{
'id':17,
'value':5.37
},
{
'id':18,
'value':5.23
},
{
'id':19,
'value':6.18
},
{
'id':20,
'value':5.44
},
{
'id':21,
'value':5.57
},
{
'id':22,
'value':5.81
},
{
'id':23,
'value':5.09
},
{
'id':24,
'value':5.08
},
{
'id':25,
'value':5.07
},
{
'id':26,
'value':6.21
},
{
'id':27,
'value':7.97
},
{
'id':28,
'value':6.54
},
{
'id':29,
'value':7.41
},
{
'id':30,
'value':6.74
},
{
'id':31,
'value':5.90
},
{
'id':32,
'value':4.55
},
{
'id':33,
'value':7.24
},
{
'id':34,
'value':5.35
},
{
'id':35,
'value':5.93
},
{
'id':36,
'value':7.62
},
{
'id':37,
'value':6.25
},
{
'id':38,
'value':7.26
},
{
'id':39,
'value':7.70
},
{
'id':40,
'value':7.84
},
{
'id':41,
'value':6.32
},
{
'id':42,
'value':6.64
},
{
'id':43,
'value':6.67
},
{
'id':44,
'value':7.07
},
{
'id':45,
'value':7.01
},
{
'id':46,
'value':6.84
},
{
'id':47,
'value':11.0
}
]
};
this.pieDataJson =
{
'data':[
{
'name': 'software',
'value':30,
},
{
'name': 'hardware',
'value':25
},
{
'name': 'device',
'value':16
},
{
'name': 'others',
'value':4
},
],
};
this.forceDataJson =
{
'groups': [
{'id': 1, 'name': 'Hokkaido'},
{'id': 2, 'name': 'Tohoku'},
{'id': 3, 'name': 'Kanto'},
{'id': 4, 'name': 'Chubu'},
{'id': 5, 'name': 'kinki'},
{'id': 6, 'name': 'Chugoku'},
{'id': 7, 'name': 'Shikoku'},
{'id': 8, 'name': 'Kyushu'},
],
'nodes': [
{'id': 'Sapporo', 'group': 1},
{'id': 'Sendai', 'group': 2},
{'id': 'Morioka', 'group': 2},
{'id': 'Akita', 'group': 2},
{'id': 'Fukushima', 'group': 2},
{'id': 'Mito', 'group': 3},
{'id': 'Utsunomiya', 'group': 3},
{'id': 'Saitama', 'group': 3},
{'id': 'Chiba', 'group': 3},
{'id': 'Tokyo', 'group': 3},
{'id': 'Kofu', 'group': 4},
{'id': 'Nagano', 'group': 4},
{'id': 'Niigata', 'group': 4},
{'id': 'Toyama', 'group': 4},
{'id': 'Kanazawa', 'group': 4},
{'id': 'Fukui', 'group': 4},
{'id': 'Shizuoka', 'group': 4},
{'id': 'Nagoya', 'group': 4},
{'id': 'Gifu', 'group': 4},
{'id': 'Otsu', 'group': 5},
{'id': 'Kyoto', 'group': 5},
{'id': 'Osaka', 'group': 5},
{'id': 'Kobe', 'group': 5},
{'id': 'Nara', 'group': 5},
{'id': 'Kyoto', 'group': 5},
{'id': 'Tottori', 'group': 6},
{'id': 'Hiroshima', 'group': 6},
{'id': 'Matsue', 'group': 6},
{'id': 'Matsuyama', 'group': 7},
{'id': 'Tokushima', 'group': 7},
{'id': 'Kochi', 'group': 7},
{'id': 'Fukuoka', 'group': 8},
{'id': 'Nagasaki', 'group': 8},
{'id': 'Kumamoto', 'group': 8},
{'id': 'Naha', 'group': 8},
],
'links': [
{'source': 'Sendai', 'target': 'Sapporo', 'value': 1},
{'source': 'Morioka', 'target': 'Sapporo', 'value': 1},
{'source': 'Akita', 'target': 'Sapporo', 'value': 1},
{'source': 'Fukushima', 'target': 'Sapporo', 'value': 1},
{'source': 'Morioka', 'target': 'Sendai', 'value': 10},
{'source': 'Akita', 'target': 'Sendai', 'value': 10},
{'source': 'Fukushima', 'target': 'Sendai', 'value': 10},
{'source': 'Chiba', 'target': 'Tokyo', 'value': 20},
{'source': 'Utsunomiya', 'target': 'Tokyo', 'value': 20},
{'source': 'Mito', 'target': 'Tokyo', 'value': 20},
{'source': 'Saitama', 'target': 'Tokyo', 'value': 30},
{'source': 'Kofu', 'target': 'Tokyo', 'value': 30},
{'source': 'Nagano', 'target': 'Tokyo', 'value': 30},
{'source': 'Naha', 'target': 'Tokyo', 'value': 30},
{'source': 'Osaka', 'target': 'Tokyo', 'value': 40},
{'source': 'Sendai', 'target': 'Tokyo', 'value': 40},
{'source': 'Hiroshima', 'target': 'Tokyo', 'value': 20},
{'source': 'Shizuoka', 'target': 'Nagoya', 'value': 10},
{'source': 'Tokyo', 'target': 'Nagoya', 'value': 40},
{'source': 'Osaka', 'target': 'Nagoya', 'value': 40},
{'source': 'Kyoto', 'target': 'Nagoya', 'value': 40},
{'source': 'Kyoto', 'target': 'Osaka', 'value': 30},
{'source': 'Hiroshima', 'target': 'Osaka', 'value': 20},
{'source': 'Toyama', 'target': 'Kanazawa', 'value': 10},
{'source': 'Fukui', 'target': 'Kanazawa', 'value': 10},
{'source': 'Niigata', 'target': 'Kanazawa', 'value': 10},
{'source': 'Tottori', 'target': 'Kobe', 'value': 10},
{'source': 'Tottori', 'target': 'Hiroshima', 'value': 10},
{'source': 'Matsue', 'target': 'Hiroshima', 'value': 10},
{'source': 'Matsuyama', 'target': 'Hiroshima', 'value': 10},
{'source': 'Tokushima', 'target': 'Kochi', 'value': 10},
{'source': 'Matsuyama', 'target': 'Kochi', 'value': 10},
{'source': 'Nagasaki', 'target': 'Fukuoka', 'value': 10},
{'source': 'Kumamoto', 'target': 'Fukuoka', 'value': 10},
{'source': 'Naha', 'target': 'Fukuoka', 'value': 10},
]
};
}
// Add End --------------------------------------------
}
Modify app.component.html
In the same directory, modify app.component.html as follows.
 <div style="text-align:center">
  <hr>
  <h2>GeoOrthographic</h2>
  <lib-Ng6UdmChart [chartType]="geoOrthographicTypeName" [configData]="configData"  [graphData]="geoOrthographicDataJson" [svgWidth]="'600'" [svgHeight]="'400'"></lib-Ng6UdmChart>
  <hr>
  <h2>Bar</h2>
  <lib-Ng6UdmChart [chartType]="barTypeName" [configData]="configData"  [graphData]="barDataJson" [svgWidth]="'600'" [svgHeight]="'400'"></lib-Ng6UdmChart>
  <hr>
  <h2>Pie</h2>
  <lib-Ng6UdmChart [chartType]="pieTypeName" [configData]="configData"  [graphData]="pieDataJson" [svgWidth]="'600'" [svgHeight]="'400'"></lib-Ng6UdmChart>
  <hr>
  <h2>ScatterPlot</h2>
  <lib-Ng6UdmChart [chartType]="scatterPlotTypeName" [configData]="configData"  [graphData]="scatterPlotDataJson" [svgWidth]="'600'" [svgHeight]="'400'"></lib-Ng6UdmChart>
  <hr>
  <h2>Histogram</h2>
  <lib-Ng6UdmChart [chartType]="histogramTypeName" [configData]="configData"  [graphData]="histogramDataJson" [svgWidth]="'600'" [svgHeight]="'400'"></lib-Ng6UdmChart>
  <hr>
  <h2>PackLayout</h2>
  <lib-Ng6UdmChart [chartType]="packLayoutTypeName" [configData]="configData"  [graphData]="packLayoutDataJson" [svgWidth]="'600'" [svgHeight]="'400'"></lib-Ng6UdmChart>
  <hr>
  <h2>Tree</h2>
  <lib-Ng6UdmChart [chartType]="treeTypeName" [configData]="configData"  [graphData]="treeDataJson" [svgWidth]="'600'" [svgHeight]="'400'"></lib-Ng6UdmChart>
  <hr>

  <h2>Line</h2>
  <lib-Ng6UdmChart [chartType]="lineTypeName" [configData]="configData"  [graphData]="lineDataJson" [svgWidth]="'600'" [svgHeight]="'400'"></lib-Ng6UdmChart>
  <hr>
  <h2>GeoMap</h2>
  <lib-Ng6UdmChart [chartType]="geoMapTypeName" [configData]="configData"  [graphData]="geoMapDataJson" [svgWidth]="'600'" [svgHeight]="'400'"></lib-Ng6UdmChart>
  <hr>
  <h2>StackBar</h2>
  <lib-Ng6UdmChart [chartType]="stackBarTypeName" [configData]="configData"  [graphData]="stackBarDataJson" [svgWidth]="'600'" [svgHeight]="'400'"></lib-Ng6UdmChart>
  <hr>
  <h2>Choropleth</h2>
  <lib-Ng6UdmChart [chartType]="choroplethTypeName" [configData]="configData"  [graphData]="choroplethDataJson" [svgWidth]="'600'" [svgHeight]="'400'"></lib-Ng6UdmChart>
  <hr>
  <h2>Force</h2>
  <lib-Ng6UdmChart [chartType]="forceTypeName" [configData]="configData"  [graphData]="forceDataJson" [svgWidth]="'600'" [svgHeight]="'400'"></lib-Ng6UdmChart>
</div>
Modify styles.css
Change to the parent directory, you will find styles.css. Modify the file as follows.
$ cd ..
.line {fill:none; stroke:black;stroke-width: 1.5;}
.line-0 {fill:none; stroke:#1f77b4;stroke-width: 1.5;stroke-dasharray:4,10;}
.line-1 {fill:none; stroke:#ff7f0e;stroke-width: 1.5;stroke-dasharray:2,5.10;}
.line-2 {fill:none; stroke:#2ca02c;stroke-width: 1.5;}
.line-3 {fill:none; stroke:#d62728;stroke-width: 1.5;}
.line-4 {fill:none; stroke:#9467bd;stroke-width: 1.5;}
.line-5 {fill:none; stroke:#8c564b;stroke-width: 1.5;}
.line-6 {fill:none; stroke:#e377c2;stroke-width: 1.5;}
.line-7 {fill:none; stroke:#7f7f7f;stroke-width: 1.5;}
.line-8 {fill:none; stroke:#bcbd22;stroke-width: 1.5;}
.line-9 {fill:none; stroke:b#17becf;stroke-width: 1.5;}

.bar { fill:#aaa; stroke:white;stroke-width: 1;}
.bar-value { fill:black;font-size: 8pt;}
.name { font-size: 10pt;text-anchor: middle}
path {fill:white;stroke:black;stroke-width:0.5;}
.axis text {
    font-family: sans-serif;
    font-size: 11px;
}
.axis path,
.axis line {
    fill: none;
    stroke: black;
}
.axis_x line {
    fill: none;
    stroke: black;
}
.chart-title { fill:red;font-size: 18pt;text-anchor: middle;}
.histogram-bar{fill:blue; stroke:white;stroke-width: 1;}
.axis-x-text{ fill:blue;font-size: 12pt;}
.treemap { stroke:black;fill:#777}
.treemap-label { font-size: 10pt;text-anchor: middle}
.packlayout{ stroke:black;}
.packlayout-label{ font-size: 10pt;text-anchor: middle}
.pie-inner-title {font-size:9pt;text-anchor:middle;}
.pieNum {font-size:10pt;text-anchor:middle;}
.grid {stroke:gray;stroke-dasharray: 4,2;shape-rendering:crispEdges}

.tree-node circle {
    fill: #fff;
    stroke: steelblue;
    stroke-width: 3px;
}
.tree-node text {
    font: 12px sans-serif;
}
.tree-node-internal text {
    text-shadow: 0 1px 0 #fff, 0 -1px 0 #fff, 1px 0 0 #fff, -1px 0 0 #fff;
}
.tree-node-link {
    fill: none;
    stroke: #ccc;
    stroke-width: 2px;
}
.force-links line {
stroke: #999;
stroke-opacity: 0.6;
}

.force-nodes circle {
stroke: #fff;
stroke-width: 1.5px;
}
Restart local server
Restart the local server as follows.
$ ng serve -oAnd you will get many charts in your browser.
First Chart (GeoOrthographic)
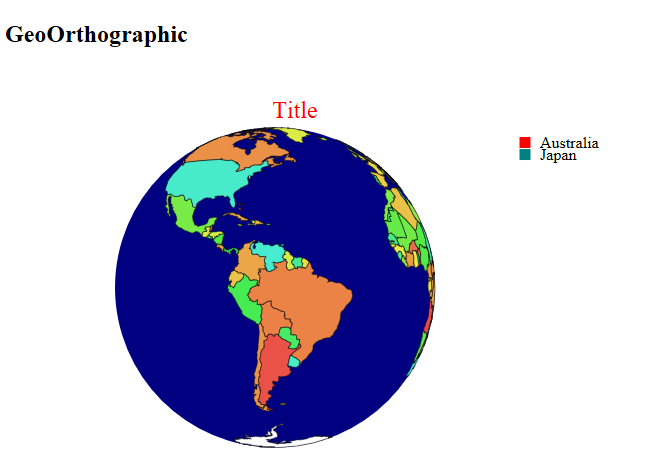
Chart Data
There are two types of data:configData,graphData.
configData
This is a common setting data of all charts. In this file, you can set info as follows.
-Class name defined by "html" file
-Title Name
-Legend (display or not, position, size)
-Color (Auto color number: 10 or 20, Opacity)
-Line (interpolate)
-Grid (display or not, position, size)
-Animation (enable or not, duration)
-Margin (top, left, right,bottom,between)
-Axis (left margin, bottom mergin)
Sample configData
        configData ={
            "className":{
                "axis":"axis",
                "axisXBorder":"axis_x",
                "axisXText":"axis-x-text",
                "bar":"bar",
                "barValue":"bar-value",
                "line":"line",
                "multiLinePrefix":"line-",
                "grid":"grid",
                "pie":"pie",
                "pieInnerTitle": "pie-inner-title",
                "pieInnerRadius":"total",
                "histogram":"histogram",
                "histogramBar":"histogram-bar",
                "treemap":"treemap",
                "treemapLabel":"treemap-label",
                "packlayout":"packlayout",
                "packlayoutLabel":"packlayout-label",
            },
            "label": {
                    "display":true,
            },
            "title": {
                "display": true,
                "name":"Title",
                "className":"chart-title",
                "height":30,
                "leftMargin":-20,
                "bottomMargin":10
            },
            "maxValue":{
                "auto":true,
                "x":100,
                "y":100,
            },
            "legend": {
                "display": true,
                "position": "right",
                "totalWidth":80,
                "initXPos":5,
                "initYPos":10,
                "rectWidth":10,
                "rectHeight":10,
                "xSpacing":2,
                "ySpacing":2
            },
            "color":{
                "auto":true, //
                "defaultColorNumber":10,
                "opacity":1.0,
                "userColors":[
                    "blue",
                    "red",
                    "green",
                    "yellow",
                    "PaleGoldenrod",
                    "Khaki",
                    "DarkKhaki",
                    "Gold",
                    "Cornsilk",
                    "BlanchedAlmond",
                    "Bisque",
                    "NavajoWhite",
                    "Wheat",
                    "BurlyWood",
                    "Tan",
                    "RosyBrown",
                    "SandyBrown",
                    "Goldenrod",
                    "DarkGoldenrod",
                    "Peru",
                    "Chocolate"
                ],
                "focusColor":"red",
            },
            "pie":{
                "innerRadius": {
                    "percent":20,
                    "title":"Total"
                },
                "value":{
                    "display":true,
                },
                "percent":{
                    "display":false,
                }
            },
            "line": {
                "legend":"lineEnd",
                "interpolate" :"linear",
            },
            "grid":{
                "x":{
                    "display":true,
                },
                "y":{
                    "display":true,
                },
            },
            "margin":{
                "top":30,
                "left":30,
                "right":10,
                "bottom":20,
                "between":5
            },
            "axis":{
                "rotation":0,
                "borderLineWidth":1,
                "xLabel":{
                    "leftMargin":0,
                    "bottomMargin":5
                },
                "yLabel":{
                    "leftMargin":0,
                    "bottomMargin":0
                },

            },
            "animation":{
                "enable":true,
                "duration":4000,
            },
        };
graphData
Each chart needs its own data in Json format.
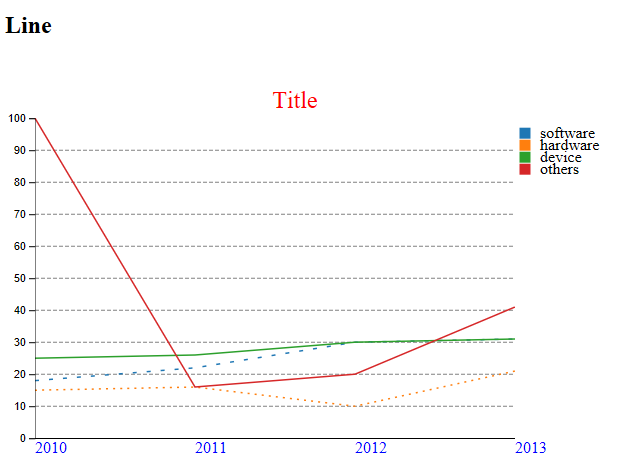
- Sample GraphData for Line
        lineDataJson =
        {
            "series":[
                "year",
                "sell",
            ],
            "data":[
                {
                    "name": "software",
                    "value":[
                        {
                            "x":"2010",
                            "y":18
                        },
                        {
                            "x":"2011",
                            "y":22
                        },
                        {
                            "x":"2012",
                            "y":30
                        },
                        {
                            "x":"2013",
                            "y":31
                        },
                    ]
                },
                {
                    "name": "hardware",
                    "value":[
                        {
                            "x":"2010",
                            "y":15
                        },
                        {
                            "x":"2011",
                            "y":16
                        },
                        {
                            "x":"2012",
                            "y":10
                        },
                        {
                            "x":"2013",
                            "y":21
                        },
                    ]
                },
                {
                    "name": "device",
                    "value":[
                        {
                            "x":"2010",
                            "y":25
                        },
                        {
                            "x":"2011",
                            "y":26
                        },
                        {
                            "x":"2012",
                            "y":30
                        },
                        {
                            "x":"2013",
                            "y":31
                        },
                    ]
                },
                {
                    "name": "others",
                    "value":[
                        {
                            "x":"2010",
                            "y":100
                        },
                        {
                            "x":"2011",
                            "y":16
                        },
                        {
                            "x":"2012",
                            "y":20
                        },
                        {
                            "x":"2013",
                            "y":41
                        },
                    ]
                },
            ],
        };
- Sample for Line
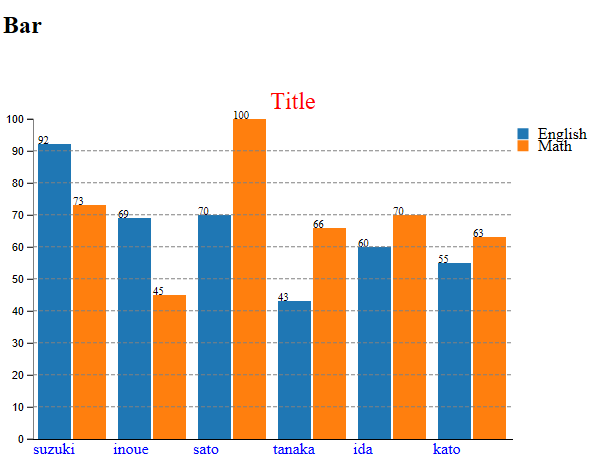
- Sample GraphData for Bar
        barDataJson =
        {
            "series":[
                "English",
                "Math"
            ],
            "data":[
                {
                    "x": "suzuki",
                    "y": [92,73],
                },
                {
                    "x": "inoue",
                    "y": [69,45],
                },
                {
                    "x": "sato",
                    "y": [70,100],
                },
                {
                    "x": "tanaka",
                    "y": [43,66],
                },
                {
                    "x": "ida",
                    "y": [60,70],
                },
                {
                    "x": "kato",
                    "y": [55,63],
                },
            ],
        };
Sample for Bar
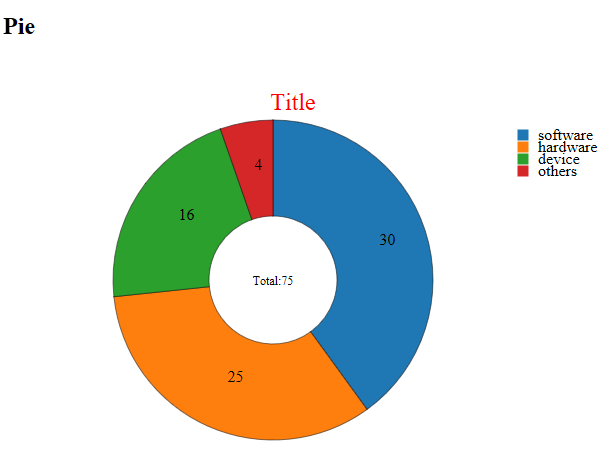
- Sample GraphData for Pie
        pieDataJson =
        {
            "data":[
                {
                    "name": "software",
                    "value":30,
                },
                {
                    "name": "hardware",
                    "value":25
                },
                {
                    "name": "device",
                    "value":16
                },
                {
                    "name": "others",
                    "value":4
                },
            ],
        };
Sample for Pie
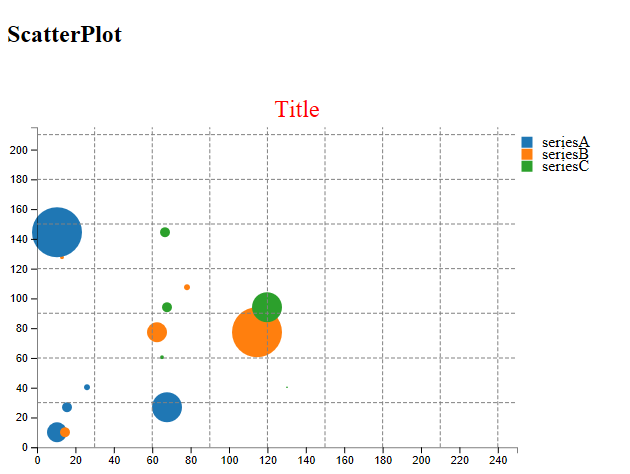
Sample GraphData for ScatterPlot
        scatterPlotDataJson =
        {
            "series":[
                "seriesA",
                "seriesB",
                "seriesC"
            ],
            "data":[
                {
                    "name": "suzuki",
                    "value":[
                        {"x":30,"y":40,"r":5},
                        {"x":120,"y":115,"r":10},
                        {"x":125,"y":90,"r":2},
                        {"x":150,"y":160,"r":1},
                        {"x":150,"y":160,"r":3},
                        {"x":128,"y":215,"r":5},
                        {"x":130,"y":40,"r":15},
                        {"x":220,"y":115,"r":25},
                    ]
                },
                {
                    "name": "inoue",
                    "value":[
                        {"x":130,"y":140,"r":5},
                        {"x":20,"y":15,"r":10},
                        {"x":25,"y":190,"r":2},
                        {"x":250,"y":60,"r":1},
                        {"x":50,"y":60,"r":3},
                        {"x":28,"y":15,"r":5},
                        {"x":230,"y":140,"r":15},
                        {"x":20,"y":215,"r":25},
                    ]
                },
            ],
        };
Sample for ScatterPlot
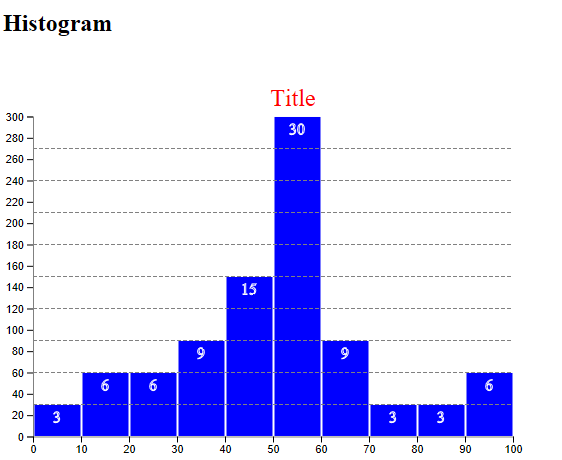
- Sample GraphData for Histogram
        histogramDataJson =
        {
            "range":[0,100],
            "bins": [0,10,20,30,40,50,60,70,80,90,100],
            "data":[
                50,95,60,44,60,50,35,20,10,8,
                56,70,65,42,22,33,40,53,52,89,
                90,55,50,55,65,72,45,35,15,45,
                50,95,60,44,60,50,35,20,10,8,
                56,70,65,42,22,33,40,53,52,89,
                90,55,50,55,65,72,45,35,15,45,
                50,95,60,44,60,50,35,20,10,8,
                56,70,65,42,22,33,40,53,52,89,
                90,55,50,55,65,72,45,35,15,45,
            ],
        };
Sample for Histogram
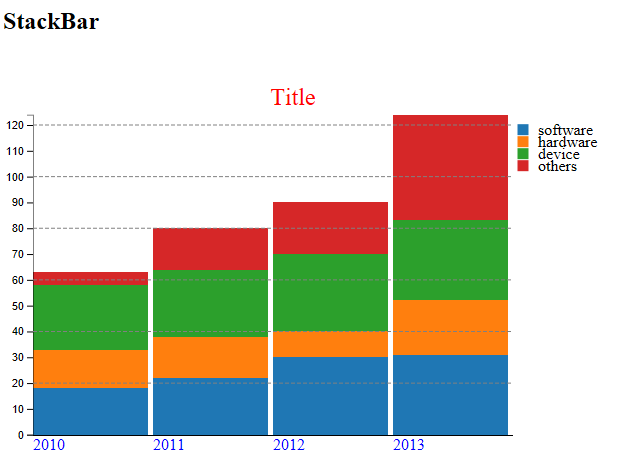
- Sample GraphData for StackBar
        stackBarDataJson =
        {
            "config":{
                "timeFormat":"%Y",
            },
            "series":[
                "year",
                "sell",
            ],
            "data":[
                {
                    "name": "software",
                    "value":[
                        {
                            "x":"2010",
                            "y":18
                        },
                        {
                            "x":"2011",
                            "y":22
                        },
                        {
                            "x":"2012",
                            "y":30
                        },
                        {
                            "x":"2013",
                            "y":31
                        },
                    ]
                },
                {
                    "name": "hardware",
                    "value":[
                        {
                            "x":"2010",
                            "y":15
                        },
                        {
                            "x":"2011",
                            "y":16
                        },
                        {
                            "x":"2012",
                            "y":10
                        },
                        {
                            "x":"2013",
                            "y":21
                        },
                    ]
                },
                {
                    "name": "device",
                    "value":[
                        {
                            "x":"2010",
                            "y":25
                        },
                        {
                            "x":"2011",
                            "y":26
                        },
                        {
                            "x":"2012",
                            "y":30
                        },
                        {
                            "x":"2013",
                            "y":31
                        },
                    ]
                },
                {
                    "name": "others",
                    "value":[
                        {
                            "x":"2010",
                            "y":5
                        },
                        {
                            "x":"2011",
                            "y":16
                        },
                        {
                            "x":"2012",
                            "y":20
                        },
                        {
                            "x":"2013",
                            "y":41
                        },
                    ]
                },
            ],
        };
Sample for StackBar
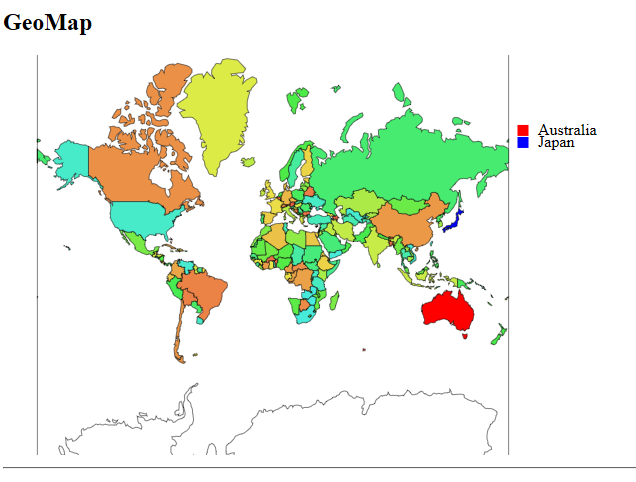
- Sample GraphData for GeoMap
        geoMapDataJson =
        {
            "map":{
                    "baseGeoDataUrl":"https://raw.githubusercontent.com/Ohtsu/data/master/o2-chart/world.geojson",
                    "scale":75,
                    "keyDataName":"features",
                    "targetPropertyName":"properties.name",
            },
            "data":[
                {
                    "name":"Australia",
                    "color":"red"
                },
                {
                    "name":"Antarctica",
                    "color":"white"
                },
                {
                    "name":"Japan",
                    "color":"blue"
                },
            ],
        };
Sample for GeoMap
- Sample GraphData for GeoOrthographic
        geoOrthographicDataJson =
        {
            "map":{
                    "baseGeoDataUrl":"https://raw.githubusercontent.com/Ohtsu/data/master/o2-chart/world.geojson",
                    "keyDataName":"features",
                    "targetPropertyName":"properties.name",
                    "scale":160,
                    "colorNumber":10,
                    "rotate":{
                        "horizontal":210,
                        "vertical":5
                    },
                    "clipAngle":90,
                    "oceanColor":"navy",
                    "antarcticaColor":"white",
            },
            "data":[
                {
                    "name":"Australia",
                    "color":"red"
                },
                {
                    "name":"Antarctica",
                    "color":"white"
                },
                {
                    "name":"Japan",
                    "color":"teal"
                },
            ]
        }
Sample for GeoOrthographic
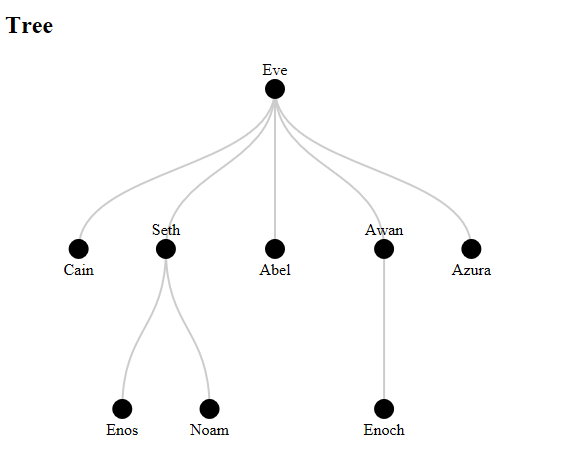
- Sample GraphData for Tree
        treeDataJson =
        {
            "name": "Eve",
            "children": [
                { "name": "Cain"
                },
                {
                    "name": "Seth",
                    "children": [
                        { "name": "Enos" },
                        { "name": "Noam" }
                    ]
                },
                { "name": "Abel"
                },
                {
                    "name": "Awan",
                    "children": [
                        { "name": "Enoch" }
                    ]
                },
                { "name": "Azura"
                },
            ]
        };
Sample for Tree
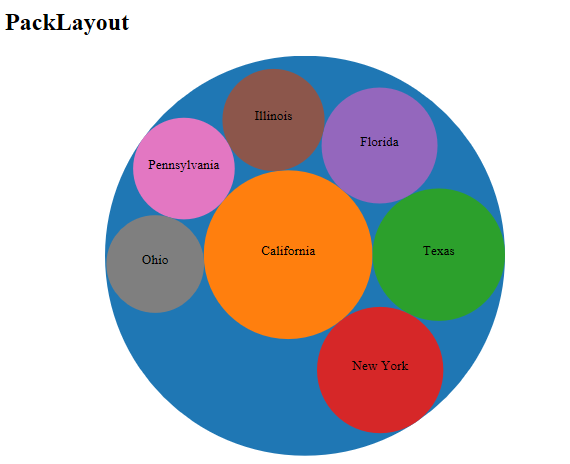
- Sample GraphData for PackLayout
        packLayoutDataJson = {
            "name":"United States", "value" :281421906,
            "children" : [
                {"name":"California", "value" :33871648},
                {"name":"Texas", "value" :20851820},
                {"name":"New York", "value" :18976457},
                {"name":"Florida", "value" :15982378},
                {"name":"Illinois", "value" :12419293},
                {"name":"Pennsylvania", "value" :12281054},
                {"name":"Ohio", "value" :11353140},
                ]
        }
Sample for PackLayout
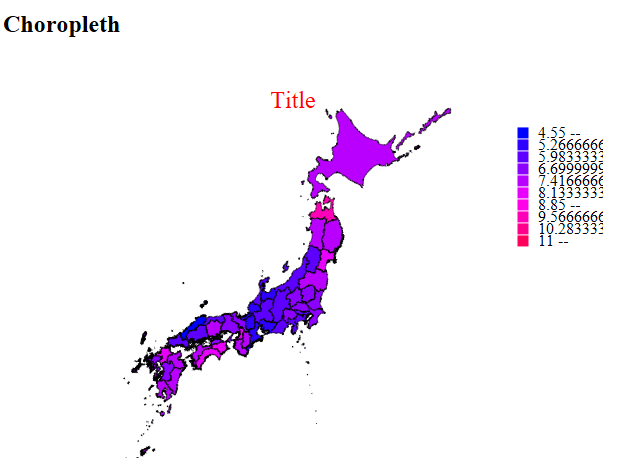
- Sample GraphData for Choropleth
        choroplethDataJson = {
            "map":{
                "baseGeoDataUrl":"https://raw.githubusercontent.com/Ohtsu/data/master/o2-chart/japan.geojson",
                "scale":900,
                "center":[137.571,37.500],
                "startColor":"blue",
                "endColor":"red",
                "colorNumber":10,
                "keyDataName":"features",
                "targetPropertyName":"properties.id"
            },

            "data":
            [
                {
                    "id":1,
                    "value":7.12
                },
                {
                    "id":2,
                    "value":8.97
                },
                {
                    "id":3,
                    "value":7.07
                },
                {
                    "id":4,
                    "value":7.78
                },
                {
                    "id":5,
                    "value":6.97
                },
                {
                    "id":6,
                    "value":5.79
                },
                {
                    "id":7,
                    "value":7.14
                },
                {
                    "id":8,
                    "value":6.68
                },
                {
                    "id":9,
                    "value":6.28
                },
                {
                    "id":10,
                    "value":6.32
                },
                {
                    "id":11,
                    "value":6.29
                },
                {
                    "id":12,
                    "value":6.14
                },
                {
                    "id":13,
                    "value":5.87
                },
                {
                    "id":14,
                    "value":5.75
                },
                {
                    "id":15,
                    "value":5.50
                },
                {
                    "id":16,
                    "value":5.21
                },
                {
                    "id":17,
                    "value":5.37
                },
                {
                    "id":18,
                    "value":5.23
                },
                {
                    "id":19,
                    "value":6.18
                },
                {
                    "id":20,
                    "value":5.44
                },
                {
                    "id":21,
                    "value":5.57
                },
                {
                    "id":22,
                    "value":5.81
                },
                {
                    "id":23,
                    "value":5.09
                },
                {
                    "id":24,
                    "value":5.08
                },
                {
                    "id":25,
                    "value":5.07
                },
                {
                    "id":26,
                    "value":6.21
                },
                {
                    "id":27,
                    "value":7.97
                },
                {
                    "id":28,
                    "value":6.54
                },
                {
                    "id":29,
                    "value":7.41
                },
                {
                    "id":30,
                    "value":6.74
                },
                {
                    "id":31,
                    "value":5.90
                },
                {
                    "id":32,
                    "value":4.55
                },
                {
                    "id":33,
                    "value":7.24
                },
                {
                    "id":34,
                    "value":5.35
                },
                {
                    "id":35,
                    "value":5.93
                },
                {
                    "id":36,
                    "value":7.62
                },
                {
                    "id":37,
                    "value":6.25
                },
                {
                    "id":38,
                    "value":7.26
                },
                {
                    "id":39,
                    "value":7.70
                },
                {
                    "id":40,
                    "value":7.84
                },
                {
                    "id":41,
                    "value":6.32
                },
                {
                    "id":42,
                    "value":6.64
                },
                {
                    "id":43,
                    "value":6.67
                },
                {
                    "id":44,
                    "value":7.07
                },
                {
                    "id":45,
                    "value":7.01
                },
                {
                    "id":46,
                    "value":6.84
                },
                {
                    "id":47,
                    "value":11.0
                }
            ]
        };
Sample for Choropleth
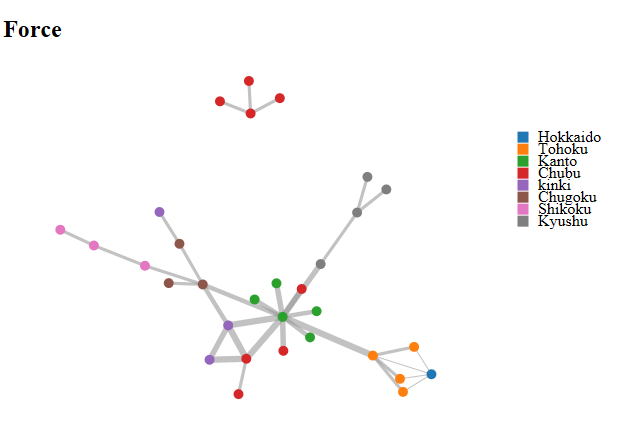
- Sample GraphData for Force
    forceDataJson =
        {
            "groups": [
                {"id": 1, "name": "Hokkaido"},
                {"id": 2, "name": "Tohoku"},
                {"id": 3, "name": "Kanto"},
                {"id": 4, "name": "Chubu"},
                {"id": 5, "name": "kinki"},
                {"id": 6, "name": "Chugoku"},
                {"id": 7, "name": "Shikoku"},
                {"id": 8, "name": "Kyushu"},
            ],
            "nodes": [
                {"id": "Sapporo", "group": 1},
                {"id": "Sendai", "group": 2},
                {"id": "Morioka", "group": 2},
                {"id": "Akita", "group": 2},
                {"id": "Fukushima", "group": 2},
                {"id": "Mito", "group": 3},
                {"id": "Utsunomiya", "group": 3},
                {"id": "Saitama", "group": 3},
                {"id": "Chiba", "group": 3},
                {"id": "Tokyo", "group": 3},
                {"id": "Kofu", "group": 4},
                {"id": "Nagano", "group": 4},
                {"id": "Niigata", "group": 4},
                {"id": "Toyama", "group": 4},
                {"id": "Kanazawa", "group": 4},
                {"id": "Fukui", "group": 4},
                {"id": "Shizuoka", "group": 4},
                {"id": "Nagoya", "group": 4},
                {"id": "Gifu", "group": 4},
                {"id": "Otsu", "group": 5},
                {"id": "Kyoto", "group": 5},
                {"id": "Osaka", "group": 5},
                {"id": "Kobe", "group": 5},
                {"id": "Nara", "group": 5},
                {"id": "Kyoto", "group": 5},
                {"id": "Tottori", "group": 6},
                {"id": "Hiroshima", "group": 6},
                {"id": "Matsue", "group": 6},
                {"id": "Matsuyama", "group": 7},
                {"id": "Tokushima", "group": 7},
                {"id": "Kochi", "group": 7},
                {"id": "Fukuoka", "group": 8},
                {"id": "Nagasaki", "group": 8},
                {"id": "Kumamoto", "group": 8},
                {"id": "Naha", "group": 8},
            ],
            "links": [
            {"source": "Sendai", "target": "Sapporo", "value": 1},
            {"source": "Morioka", "target": "Sapporo", "value": 1},
            {"source": "Akita", "target": "Sapporo", "value": 1},
            {"source": "Fukushima", "target": "Sapporo", "value": 1},
            {"source": "Morioka", "target": "Sendai", "value": 10},
            {"source": "Akita", "target": "Sendai", "value": 10},
            {"source": "Fukushima", "target": "Sendai", "value": 10},
            {"source": "Chiba", "target": "Tokyo", "value": 20},
            {"source": "Utsunomiya", "target": "Tokyo", "value": 20},
            {"source": "Mito", "target": "Tokyo", "value": 20},
            {"source": "Saitama", "target": "Tokyo", "value": 30},
            {"source": "Kofu", "target": "Tokyo", "value": 30},
            {"source": "Nagano", "target": "Tokyo", "value": 30},
            {"source": "Naha", "target": "Tokyo", "value": 30},
            {"source": "Osaka", "target": "Tokyo", "value": 40},
            {"source": "Sendai", "target": "Tokyo", "value": 40},
            {"source": "Hiroshima", "target": "Tokyo", "value": 20},
            {"source": "Shizuoka", "target": "Nagoya", "value": 10},
            {"source": "Tokyo", "target": "Nagoya", "value": 40},
            {"source": "Osaka", "target": "Nagoya", "value": 40},
            {"source": "Kyoto", "target": "Nagoya", "value": 40},
            {"source": "Kyoto", "target": "Osaka", "value": 30},
            {"source": "Hiroshima", "target": "Osaka", "value": 20},
            {"source": "Toyama", "target": "Kanazawa", "value": 10},
            {"source": "Fukui", "target": "Kanazawa", "value": 10},
            {"source": "Niigata", "target": "Kanazawa", "value": 10},
            {"source": "Tottori", "target": "Kobe", "value": 10},
            {"source": "Tottori", "target": "Hiroshima", "value": 10},
            {"source": "Matsue", "target": "Hiroshima", "value": 10},
            {"source": "Matsuyama", "target": "Hiroshima", "value": 10},
            {"source": "Tokushima", "target": "Kochi", "value": 10},
            {"source": "Matsuyama", "target": "Kochi", "value": 10},
            {"source": "Nagasaki", "target": "Fukuoka", "value": 10},
            {"source": "Kumamoto", "target": "Fukuoka", "value": 10},
            {"source": "Naha", "target": "Fukuoka", "value": 10},
               ]
        };
Sample for Force